East Peoria, Illinois
East Peoria: city on the Illinois River in Tazewell County, Illinois, USA
About
East Peoria is a city located in the county of Tazewell in the U.S. state of Illinois. Its population at the 2010 census was 23,402 and a population density of 404 people per km². After 10 years in 2020 city had an estimated population of 22,344 inhabitants.

Quick Facts about East Peoria
| Population | 22,344 (2020) |
| Country | United States of America |
| State | Illinois (United States) |
| County | Tazewell County |
| Postal code | 61611 |
| Phone Area Codes | 309 |
| Area | 57.86 km2 |
| Latitude & Longitude | 40.6662,-89.5801 |
| Altitude | 489 feet / 149 meters |
| Time Zone | America/Chicago |
| Local time | 15:14:05 (18th July 2026) |
| Density | 386 Pop. per km² as of 2020 |
| Population growth | -4.74% (2010-2020) |
| Weather | 95℉ Sunny then Chance Showers And Thunderstorms 7-days weather |
Geography
East Peoria is located at 40°39'58"N 89°34'48"W (40.6661500, -89.5801000).
East Peoria map
Weather
A chance of showers and thunderstorms after 5pm. Sunny, with a high near 95. Heat index values as high as 106. West wind 5 to 9 mph, with gusts as hig...
7-Day ForecastOfficial website of East Peoria
Official WebsiteDemographics
According to census records, the population of East Peoria decreased by 4.74% in 10 years.
| Year | Population | % Change | Method |
|---|---|---|---|
| 2010 | 23,402 | - | census |
| 2011 | 23,497 | 0.4% | estimation process |
| 2012 | 23,520 | 0.1% | estimation process |
| 2013 | 23,506 | -0.06% | estimation process |
| 2014 | 23,364 | -0.61% | estimation process |
| 2015 | 23,044 | -1.39% | estimation process |
| 2016 | 22,915 | -0.56% | estimation process |
| 2017 | 22,806 | -0.48% | estimation process |
| 2018 | 22,627 | -0.79% | estimation process |
| 2019 | 22,546 | -0.36% | estimation process |
| 2020 | 22,344 | -0.9% | estimation process |
Demographic Facts
| Estimated population as of July 1, 2019 : | 12,476 |
| Based on demographic estimates as of April 1, 2010 : | 12,072 |
| Based on demographic estimates as of 1 April 2010 : | 3.3% |
| April 1, 2020 Population : | 12,844 |
| April 1, 2010 Population : | 12,072 |
| People under 5 years old, percentage : | 7.5% |
| People under 18 years old, percentage : | 23.6% |
| People over 65 (%) : | 11.8% |
| Female persons, % : | 50.8% |
| White only, percent : | 87.6% |
| Black or African American alone, percent : | 2.1% |
| American Indian and Alaska Native only, % : | 0.9% |
| Asians alone % : | 1.5% |
| Only Native Hawaiians and Other Pacific Islanders, % : | 0.0% |
| % of people who have participated in two or more races : | 4.8% |
| % of Hispanic or Latino : | 29.6% |
| White people, not Hispanic or Latino people, make up the majority of the population. : | 62.1% |
| 2015-2019 Veterans : | 945 |
| Percentage of foreign-born people, 2015-2019 : | 10.7% |
| Rate of owner-occupied housing units, 2015-2019 : | 45.4% |
Economic Facts
| Rate of owner-occupied housing units, 2015-2019 : | 45.4% |
| Owner-occupied housing unit median value, 2015-2019 : | $207,200 |
| From 2015 to 2019, the median selected monthly owner costs - with a mortgage : | $1,527 |
| Monthly owner costs, without a mortgage, at the median, 2015-2019 : | $439 |
| 2015-2019 median gross rent : | $933 |
| 2015-2019 Households : | 4,756 |
| Population per household, 2015-2019 : | 2.47 |
| Living in the same house a year ago, percentage of people aged one year and up, 2015-2019 : | 77.3% |
| Languages other than English spoken at home, as a percentage of people aged 5 and up, 2015-2019 : | 19.1% |
| Households with computers, %, 2015-2019 : | 86.3% |
| Percentage of households with a broadband Internet subscription, 2015-2019 : | 80.7% |
| Percentage of people aged 25 and up with a high school diploma or higher, 2015-2019 : | 83.8% |
| Bachelor's degree or higher, proportion of people aged 25 and up, 2015-2019 : | 13.7% |
| Percentage of people under the age of 65 who have a disability, 2015-2019 : | 11.0% |
| Persons under the age of 65 who do not have health insurance, as a percentage : | 8.1% |
| Total civilian labor force, percent of population aged 16 and up, 2015-2019 : | 58.8% |
| Female labor force participation in the civilian labor force, as a percentage of the population aged 16 and up, 2015-2019 : | 56.0% |
| Total sales of lodging and food services in 2012 ($1,000) : | 33,185 |
| Total receipts/revenue for health care and social assistance in 2012 ($1,000) : | 359,780 |
| Manufacturers' total shipments in 2012 ($1,000) : | 12,213 |
| 2012 total retail sales ($1,000) : | 232,819 |
| 2012 total retail sales per capita : | $19,159 |
| Mean commute time to work (in minutes), workers aged 16 and up, 2015-2019 : | 22.5 |
| 2015-2019 median household income (in 2019 dollars) : | $44,839 |
| Income per capita in the previous 12 months (in 2019 dollars), 2015-2019 : | $22,891 |
| Percentage of people living in poverty : | 19.7% |
| Total number of businesses in 2012 : | 858 |
| Men-owned businesses in 2012 : | 434 |
| Women-owned businesses in 2012 : | 291 |
| Minority-owned businesses in 2012 : | 215 |
| Non-minority-owned businesses in 2012 : | 590 |
| Veteran-owned businesses in 2012 : | 177 |
| Nonveteran-owned businesses in 2012 : | 627 |
| 2010 population per square mile : | 3,485.1 |
| 2010 land area in square miles : | 3.46 |
Best Things to Do in East Peoria
1Par-A-Dice Hotel Casino
21 Blackjack Blvd, East Peoria, IL 61611, United States View details
Phone: +13096997711 | Website available

2Fon Du Lac Farm Park
305 Neumann Dr, East Peoria, IL 61611, United States View details
Phone: +13096942195 | Website available
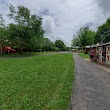
3East Peoria River Front Park
1201 Riverside Dr, East Peoria, IL 61611, United States View details
Phone: +13096893019 | Website available

4Neumann Park
305 Neumann Dr, East Peoria, IL 61611, United States View details

5Roc Ice Cream and Golf
220 Farmdale Rd, East Peoria, IL 61611, United States View details
Phone: +13096980647

Where to Eat in East Peoria
1Buffalo Wild Wings
833 W Camp St, East Peoria, IL 61611, United States View details
Phone: +13096999464 | Website available

2Red Robin Gourmet Burgers and Brews
314 West Washington Street, East Peoria, IL 61611, United States View details
Phone: +13096942144 | Website available

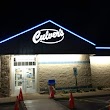
3Culver's
901 W Camp St, East Peoria, IL 61611, United States View details
Phone: +13096989240 | Website available
4Chili's Grill & Bar
800 Riverside Dr, East Peoria, IL 61611, United States View details
Phone: +13096944460 | Website available

5IHOP
214 W Camp St, East Peoria, IL 61611, United States View details
Phone: +13096983244 | Website available

Where to Stay in East Peoria
1Embassy Suites by Hilton East Peoria Riverfront Hotel & Conference Center
100 Conference Center Dr, East Peoria, IL 61611, United States View details
Phone: +13096940200 | Website available

2Stoney Creek Hotel Peoria
101 Mariners Way, East Peoria, IL 61611, United States View details
Phone: +13096941300 | Website available
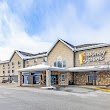
3Residence Inn by Marriott East Peoria
201 Eastlight Court, East Peoria, IL 61611, United States View details
Phone: +13096984011 | Website available

Services and Civic Places in East Peoria
1East Peoria City Hall
401 West Washington Street, East Peoria, IL 61611 View details
Phone: +13096984715 | Website available

2East Peoria City Hall & Water Department
401 West Washington Street, East Peoria, IL 61611 View details
Phone: +13096984715 | Website available
3East Peoria TOWNSHIP BUILDING
103 SANTA FE TRAIL, IL-26, East Peoria, IL 61611 View details
Website available
4Spring Bay Township Hall
103 Santa Fe Trail, East Peoria, IL 61611 View details
Phone: +13098220471
People born in East Peoria (3)
People born in East Peoria, including basketball player Roger Phegley, businessman Howard Lance, martial artist Kenny Robertson, .
More notable people
Nearby Schools and Colleges
Schools and campuses linked to East Peoria, IL. Select a name to open its map and contact details.
| Code | Name | City | ZIP |
|---|---|---|---|
| 147819 | Oehrlein School of Cosmetology | East Peoria (IL) | 61611 |
Nearby Transit Stations (12)
Rail and bus stations connected to East Peoria, IL. Select a station to open its map and address details.
| Code | Name | Address | Type |
|---|---|---|---|
| PIA | Peoria, Illinois | 6100 West Everett M. Dirksen Parkway | BUS |
| BNL | Uptown Station | 100 East Parkinson St. | RAIL |
| LCN | Lincoln | Broadway and North Chicago Sts. | RAIL |
| KEE | Kewanee | Loomis and North Tremont Sts. | RAIL |
| GBB | Galesburg station | 225 South Seminary Street | RAIL |
Closest post offices linked to East Peoria.
| Post Office Name | City | ZIP |
|---|---|---|
| East Peoria Branch Post Office | East Peoria (IL) | 61611 |
Other cities in Tazewell County
Cities, towns, neighborhoods & other populated places in Tazewell County , IL. (more)
| City Name | Population | Title |
|---|---|---|
| Pekin | 31,808 | County seat of Tazewell County, Illinois |
| Washington | 16,395 | City in Tazewell County, Illinois |
| Morton | 16,232 | Village in Tazewell County, Illinois |
| Creve Coeur | 5,109 | Village in Illinois, United States |
| Marquette Heights | 2,617 | City in Tazewell County, Illinois, United States |
| Mackinaw | 2,430 | City in Tazewell County, Illinois, United States of America |
| Wesley | 2,130 | Township in Will County, Illinois |
| Tremont | 2,114 | City in Itawamba County, Mississippi, United States of America |
| Delavan | 1,596 | Township in Tazewell County, Illinois |
| North Pekin | 1,530 | Village in Illinois, USA |
| Minier | 1,180 | City in Tazewell County, Illinois, United States of America |
| South Pekin | 1,081 | Village in Illinois, USA |
| Hopedale | 998 | Township in Tazewell County, Illinois |
| Dillon | 957 | Human settlement in United States of America |
| Cooper | 862 | Unincorporated community in Illinois |
| Deer Creek | 657 | Village mostly in Tazewell County, Illinois, USA |
Distance to Other Cities
East Peoria distances to largest Illinois cities