Mongolia, MN
Mongolia: This landlocked country in East Asia is characterized by vast, rugged expanses and a nomadic culture.
About

Country Snapshot
Mongolia at a glance
Mongolia currently has 19 quality-checked populated place pages and 23 state or regional pages linked on MapSof.
Mapped cities & towns
19
These counts use a stricter populated-place filter so the main lists stay focused on real city and town pages.
States & regions
23
Open related pagesLargest city
Ulan BatorPopulation 1,396,288
Top linked places
Quick Facts about Mongolia
| Population | 3,544,835 |
| Country | Mongolia |
| Plate code | MGL |
| Area | 1566000 km2 |
| Official name | Mongolie, la Mongolie |
| Continent | Asia |
| Easternmost point | Point(119.9314 46.8476) |
| Northernmost point | Point(98.92 52.15) |
| Latitude & Longitude | 46.0000,105.0000 |
| Legislative body | State Great Khural |
| Named for | Mongols |
| Official language | Mongolian |
| Capital | Ulaanbaatar |
| Time Zone | UTC+08:00 |
| Local time | 07:51:58 (10th June 2026) |

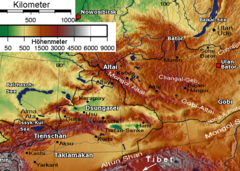
Geography
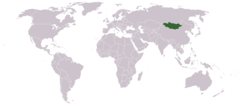
Mongolia is located at 46°0'0"N 105°0'0"E (46.0000000, 105.0000000). It has 2 neighbors: China and Russia.
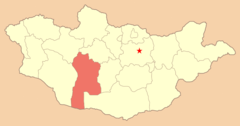
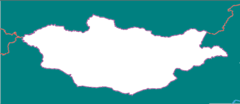
Mongolia map
The largest city of Mongolia is Ulan Bator with a population of 1,396,288. Other cities include, Mörön population 27,690 and Mandalgovi population 15,430. See all Mongolia cities & populated places.
Official website of Mongolia
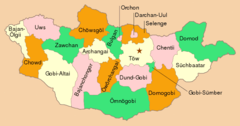
Official Website- Uvs Province
- Govi-Altai Province
- Dundgovi Province
- Darkhan-Uul Province
- Övörkhangai Province
- Bulgan Province
- Ulaanbaatar
- Selenge Province
- Zavkhan Province
- Sükhbaatar Province
- Khentii Province
- Bayankhongor Province
- Dornod Province
- Töv Province
- Orkhon Province
- Govisümber Province
- Khövsgöl Province
- Dornogovi Province
- Arkhangai Province
- Ömnögovi Province
- Bayan-Ölgii Province
- Khovd Province
Demographics
| Year | Population | % Change | Method |
|---|---|---|---|
| 1960 | 955,508 | - | estimation process |
| 1961 | 982,174 | 2.71% | estimation process |
| 1962 | 1,011,322 | 2.88% | estimation process |
| 1963 | 1,042,377 | 2.98% | estimation process |
| 1964 | 1,074,511 | 2.99% | estimation process |
| 1965 | 1,107,119 | 2.95% | estimation process |
| 1966 | 1,139,955 | 2.88% | estimation process |
| 1967 | 1,173,180 | 2.83% | estimation process |
| 1968 | 1,207,102 | 2.81% | estimation process |
| 1969 | 1,242,208 | 2.83% | estimation process |
| 1970 | 1,278,820 | 2.86% | estimation process |
| 1971 | 1,317,044 | 2.9% | estimation process |
| 1972 | 1,356,666 | 2.92% | estimation process |
| 1973 | 1,397,302 | 2.91% | estimation process |
| 1974 | 1,438,421 | 2.86% | estimation process |
| 1975 | 1,479,648 | 2.79% | estimation process |
| 1976 | 1,520,864 | 2.71% | estimation process |
| 1977 | 1,562,211 | 2.65% | estimation process |
| 1978 | 1,603,907 | 2.6% | estimation process |
| 1979 | 1,646,290 | 2.57% | estimation process |
| 1980 | 1,689,621 | 2.56% | estimation process |
| 1981 | 1,733,477 | 2.53% | estimation process |
| 1982 | 1,777,724 | 2.49% | estimation process |
| 1983 | 1,823,211 | 2.49% | estimation process |
| 1984 | 1,871,083 | 2.56% | estimation process |
| 1985 | 1,921,881 | 2.64% | estimation process |
| 1986 | 1,976,309 | 2.75% | estimation process |
| 1987 | 2,033,347 | 2.81% | estimation process |
| 1988 | 2,089,721 | 2.7% | estimation process |
| 1989 | 2,141,016 | 2.4% | estimation process |
| 1990 | 2,184,159 | 1.98% | estimation process |
| 1991 | 2,217,937 | 1.52% | estimation process |
| 1992 | 2,243,525 | 1.14% | estimation process |
| 1993 | 2,263,224 | 0.87% | estimation process |
| 1994 | 2,280,519 | 0.76% | estimation process |
| 1995 | 2,298,063 | 0.76% | estimation process |
| 1996 | 2,316,598 | 0.8% | estimation process |
| 1997 | 2,335,723 | 0.82% | estimation process |
| 1998 | 2,355,618 | 0.84% | estimation process |
| 1999 | 2,376,197 | 0.87% | estimation process |
| 2000 | 2,397,473 | 0.89% | estimation process |
| 2001 | 2,419,669 | 0.92% | estimation process |
| 2002 | 2,443,231 | 0.96% | estimation process |
| 2003 | 2,468,595 | 1.03% | estimation process |
| 2004 | 2,496,248 | 1.11% | estimation process |
| 2005 | 2,526,502 | 1.2% | estimation process |
| 2006 | 2,559,496 | 1.29% | estimation process |
| 2007 | 2,595,068 | 1.37% | estimation process |
| 2008 | 2,632,834 | 1.43% | estimation process |
| 2009 | 2,672,223 | 1.47% | estimation process |
| 2010 | 2,712,738 | 1.49% | estimation process |
| 2011 | 2,754,209 | 1.51% | estimation process |
| 2012 | 2,796,484 | 1.51% | estimation process |
| 2013 | 2,839,073 | 1.5% | estimation process |
| 2014 | 3,081,678 | 7.87% | estimation process |
| 2015 | 2,998,439 | -2.78% | (Worldbank) |
| 2016 | 3,056,359 | 1.9% | (Worldbank) |
| 2017 | 3,075,647 | 0.63% | estimation process |
| 2018 | 3,170,208 | 2.98% | (Worldbank) |
| 2019 | 3,225,167 | 1.7% | (Worldbank) |
| 2026 | 3,544,835 | 9.02% |
Map & Images (more maps)
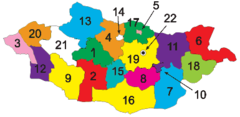
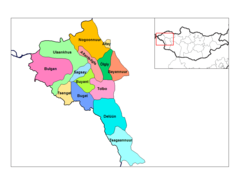
Aimags
Altai,tienschan Orte
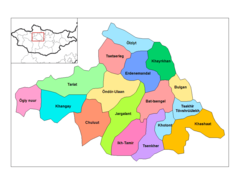
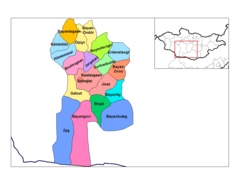
Arhangay Somon
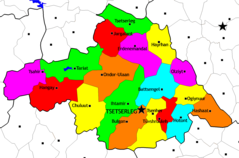
Arhangay Sums
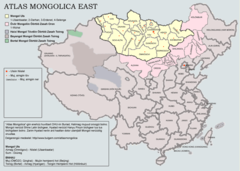
Atlas Mongolica East
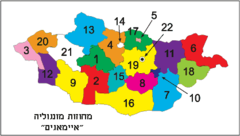
Aymags He
Bayan Olgiy Somon
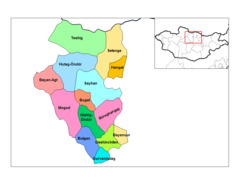
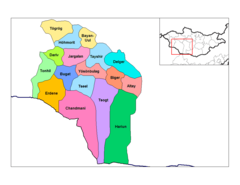
Bayanhongor Somon
Bulgan Somon
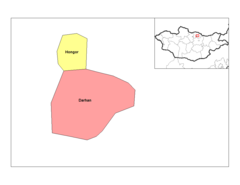
Darhan Uul Somon
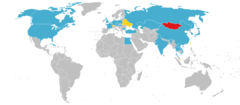
Diplomatic Missions of Mongolia
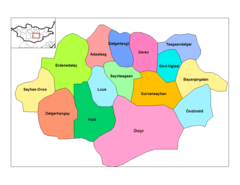
Dundgovi Somon
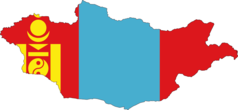
Flag Map of Mongolia
Govi Altay Somon
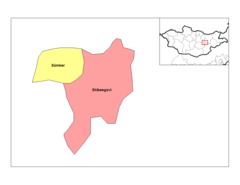
Govisumber Somon
Location Map Mongolia
Locationmongolia
Map Mn Aimags De
Map Mn Arkhangai Aimag
Map Mn Bayan Ulgii Aimag