Finland (Republic of Finland), FI
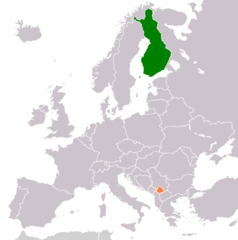
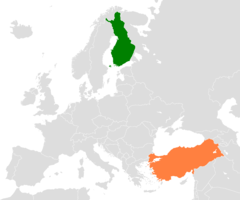
Finland: Located in Northern Europe, this parliamentary republic shares borders with Sweden, Norway, and Russia.
About

Country Snapshot
Republic of Finland at a glance
Republic of Finland currently has 346 quality-checked populated place pages and 18 state or regional pages linked on MapSof.
Mapped cities & towns
346
These counts use a stricter populated-place filter so the main lists stay focused on real city and town pages.
States & regions
18
Open related pagesLargest city
HelsinkiPopulation 642,045
Top linked places
Quick Facts about Republic of Finland
| Population | 5,650,325 |
| Country | Finland |
| Twitter username | thisisFINLAND |
| Plate code | FIN |
| Area | 338424.38 km2 |
| Official name | la République de Finlande, Suomi, Soome Vabariik, Republiken Finland, Lääˊddjânnam, Suomen tasavalta, Suomâ, Finská republika |
| Continent | Europe |
| Easternmost point | Point(31.584166666 62.908611111) |
| Northernmost point | Point(27.884166666 70.0825) |
| Latitude & Longitude | 64.0000,26.0000 |
| Patron saint | Henry |
| Legislative body | Parliament of Finland |
| Named for | Finns |
| Official language | Finnish, Swedish |
| Capital | Helsinki |
| Establishment | July 17, 1919 (106 years ago) |
| Time Zone | Europe/Helsinki, Eastern European Summer Time, Eastern European Time, UTC+02:00, UTC+03:00 |
| Local time | 11:20:16 (15th June 2026) |

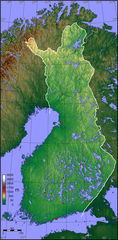
Geography
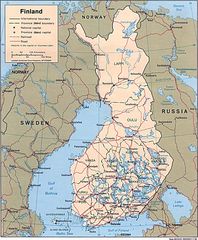
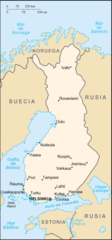
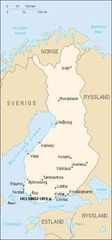
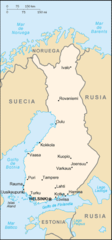
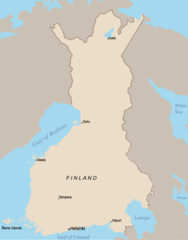
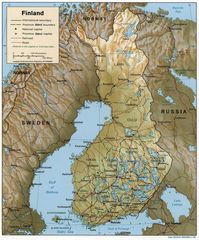
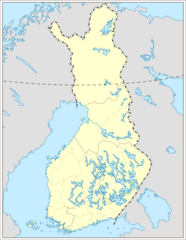
Republic of Finland is located at 64°0'0"N 26°0'0"E (64.0000000, 26.0000000). It has 3 neighbors: Russia, Sweden and Norway.
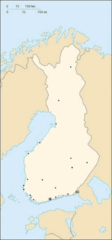
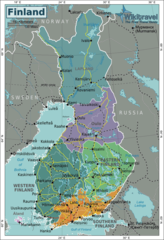
Finland map
The largest city of Republic of Finland is Helsinki with a population of 642,045. Other cities include, Espoo population 279,044, Tampere population 231,853, Vantaa population 223,027 and Oulu population 201,810. See all Republic of Finland cities & populated places.
- Northern Savonia
- Pirkanmaa
- Ostrobothnia
- Päijänne Tavastia
- Southern Savonia
- Northern Ostrobothnia
- Central Ostrobothnia
- Åland Islands
- South Karelia
- Lapland
- Southern Ostrobothnia
- Kymenlaakso
- Finland Proper
- Central Finland
- Kainuu
- Uusimaa
- North Karelia
- Satakunta
- Tavastia Proper
Demographics
| Year | Population | % Change | Method |
|---|---|---|---|
| 1960 | 4,429,634 | - | estimation process |
| 1961 | 4,461,005 | 0.7% | estimation process |
| 1962 | 4,491,443 | 0.68% | estimation process |
| 1963 | 4,523,309 | 0.7% | estimation process |
| 1964 | 4,548,543 | 0.55% | estimation process |
| 1965 | 4,563,732 | 0.33% | estimation process |
| 1966 | 4,580,869 | 0.37% | estimation process |
| 1967 | 4,605,744 | 0.54% | estimation process |
| 1968 | 4,626,469 | 0.45% | estimation process |
| 1969 | 4,623,785 | -0.06% | estimation process |
| 1970 | 4,606,307 | -0.38% | estimation process |
| 1971 | 4,612,124 | 0.13% | estimation process |
| 1972 | 4,639,657 | 0.59% | estimation process |
| 1973 | 4,666,081 | 0.57% | estimation process |
| 1974 | 4,690,574 | 0.52% | estimation process |
| 1975 | 4,711,440 | 0.44% | estimation process |
| 1976 | 4,725,664 | 0.3% | estimation process |
| 1977 | 4,738,902 | 0.28% | estimation process |
| 1978 | 4,752,528 | 0.29% | estimation process |
| 1979 | 4,764,690 | 0.26% | estimation process |
| 1980 | 4,779,535 | 0.31% | estimation process |
| 1981 | 4,799,964 | 0.43% | estimation process |
| 1982 | 4,826,933 | 0.56% | estimation process |
| 1983 | 4,855,787 | 0.59% | estimation process |
| 1984 | 4,881,803 | 0.53% | estimation process |
| 1985 | 4,902,206 | 0.42% | estimation process |
| 1986 | 4,918,154 | 0.32% | estimation process |
| 1987 | 4,932,123 | 0.28% | estimation process |
| 1988 | 4,946,481 | 0.29% | estimation process |
| 1989 | 4,964,371 | 0.36% | estimation process |
| 1990 | 4,986,431 | 0.44% | estimation process |
| 1991 | 5,013,740 | 0.54% | estimation process |
| 1992 | 5,041,992 | 0.56% | estimation process |
| 1993 | 5,066,447 | 0.48% | estimation process |
| 1994 | 5,088,333 | 0.43% | estimation process |
| 1995 | 5,107,790 | 0.38% | estimation process |
| 1996 | 5,124,573 | 0.33% | estimation process |
| 1997 | 5,139,835 | 0.3% | estimation process |
| 1998 | 5,153,498 | 0.27% | estimation process |
| 1999 | 5,165,474 | 0.23% | estimation process |
| 2000 | 5,176,209 | 0.21% | estimation process |
| 2001 | 5,188,008 | 0.23% | estimation process |
| 2002 | 5,200,598 | 0.24% | estimation process |
| 2003 | 5,213,014 | 0.24% | estimation process |
| 2004 | 5,228,172 | 0.29% | estimation process |
| 2005 | 5,246,096 | 0.34% | estimation process |
| 2006 | 5,266,268 | 0.38% | estimation process |
| 2007 | 5,288,720 | 0.42% | estimation process |
| 2008 | 5,313,399 | 0.46% | estimation process |
| 2009 | 5,338,871 | 0.48% | estimation process |
| 2010 | 5,363,352 | 0.46% | estimation process |
| 2011 | 5,388,272 | 0.46% | estimation process |
| 2012 | 5,413,971 | 0.47% | estimation process |
| 2013 | 5,438,972 | 0.46% | estimation process |
| 2014 | 5,470,437 | 0.58% | estimation process |
| 2015 | 5,479,531 | 0.17% | (Worldbank) |
| 2016 | 5,501,043 | 0.39% | estimation process |
| 2017 | 5,516,224 | 0.28% | estimation process |
| 2018 | 5,515,525 | -0.01% | (Worldbank) |
| 2019 | 5,520,314 | 0.09% | (Worldbank) |
| 2026 | 5,650,325 | 2.3% |
Map & Images (more maps)
000 Finlanda Harta
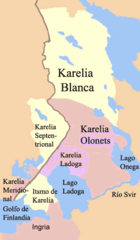
349px Muchas Karelias
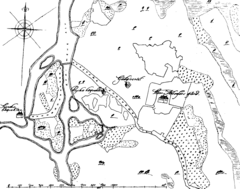
Abborfors Karta 1700 Talet
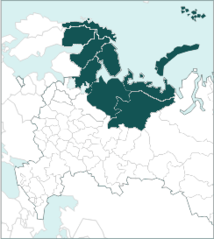
Barents Region
Bedrock of Finland
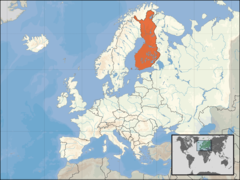
Europe Location Fin
Fi Map Ast
Fi Map
Fi Map 1
Finland 1920
Finland 1996 Cia Map
Finland Kosovo Locator 2
Finland Turkey Locator 1

Finland Equi2

Finland Flag Map
Finland Regions Map
Finland Equi
Finland Locator Map
Finland Topo Blank
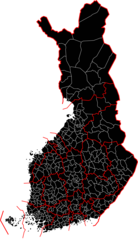
Muncipalities And Provinces of Finland Black