Browning, Montana
Browning: town in Montana
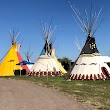
About
Browning is a town located in the county of Glacier in the U.S. state of Montana. Its population at the 2010 census was 1,016 and a population density of 1,420 people per km². After 10 years in 2020 city had an estimated population of 1,001 inhabitants.
Quick Facts about Browning
| Population | 1,001 (2020) |
| Country | United States of America |
| State | Montana (United States) |
| County | Glacier County |
| Postal code | 59417 |
| Phone Area Codes | 406 |
| Area | 0.72 km2 |
| Latitude & Longitude | 48.5569,-113.0134 |
| Altitude | 4,377 feet / 1334 meters |
| Time Zone | Mountain Time Zone |
| Local time | 02:16:14 (15th June 2026) |
| Density | 1,399 Pop. per km² as of 2020 |
| Population growth | -1.5% (2010-2020) |
| Weather | 45℉ Mostly Clear 7-days weather |
Geography
Browning is located at 48°33'25"N 113°0'48"W (48.5569200, -113.0134200).
Browning map
Weather
Mostly clear, with a low around 45. South southeast wind 6 to 9 mph.
7-Day ForecastOfficial website of Browning
Official WebsiteDemographics
According to census records, the population of Browning decreased by 1.5% in 10 years.
| Year | Population | % Change | Method |
|---|---|---|---|
| 2010 | 1,016 | - | census |
| 2011 | 1,005 | -1.09% | estimation process |
| 2012 | 1,009 | 0.4% | estimation process |
| 2013 | 1,019 | 0.98% | estimation process |
| 2014 | 1,009 | -0.99% | estimation process |
| 2015 | 1,006 | -0.3% | estimation process |
| 2016 | 1,011 | 0.49% | estimation process |
| 2017 | 1,013 | 0.2% | estimation process |
| 2018 | 1,020 | 0.69% | estimation process |
| 2019 | 1,014 | -0.59% | estimation process |
| 2020 | 1,001 | -1.3% | estimation process |
Demographic Facts
| Estimated population as of July 1, 2019 : | 16,337 |
| Based on demographic estimates as of April 1, 2010 : | 16,244 |
| Based on demographic estimates as of 1 April 2010 : | 0.6% |
| April 1, 2020 Population : | 16,032 |
| April 1, 2010 Population : | 16,239 |
| People under 5 years old, percentage : | 5.7% |
| People under 18 years old, percentage : | 21.4% |
| People over 65 (%) : | 20.9% |
| Female persons, % : | 49.7% |
| White only, percent : | 95.8% |
| Black or African American alone, percent : | 0.6% |
| American Indian and Alaska Native only, % : | 0.9% |
| Asians alone % : | 0.7% |
| Only Native Hawaiians and Other Pacific Islanders, % : | Z |
| % of people who have participated in two or more races : | 2.0% |
| % of Hispanic or Latino : | 1.7% |
| White people, not Hispanic or Latino people, make up the majority of the population. : | 94.4% |
| 2015-2019 Veterans : | 1,336 |
| Percentage of foreign-born people, 2015-2019 : | 1.0% |
| Residential units, July 1, 2019 : | 8,016 |
Economic Facts
| Residential units, July 1, 2019 : | 8,016 |
| Rate of owner-occupied housing units, 2015-2019 : | 84.8% |
| Owner-occupied housing unit median value, 2015-2019 : | $163,900 |
| From 2015 to 2019, the median selected monthly owner costs - with a mortgage : | $1,340 |
| Monthly owner costs, without a mortgage, at the median, 2015-2019 : | $482 |
| 2015-2019 median gross rent : | $816 |
| Permits for construction, 2020 : | 55 |
| 2015-2019 Households : | 6,439 |
| Population per household, 2015-2019 : | 2.46 |
| Living in the same house a year ago, percentage of people aged one year and up, 2015-2019 : | 89.9% |
| Languages other than English spoken at home, as a percentage of people aged 5 and up, 2015-2019 : | 2.8% |
| Households with computers, %, 2015-2019 : | 85.9% |
| Percentage of households with a broadband Internet subscription, 2015-2019 : | 76.1% |
| Percentage of people aged 25 and up with a high school diploma or higher, 2015-2019 : | 90.2% |
| Bachelor's degree or higher, proportion of people aged 25 and up, 2015-2019 : | 14.7% |
| Percentage of people under the age of 65 who have a disability, 2015-2019 : | 12.5% |
| Persons under the age of 65 who do not have health insurance, as a percentage : | 6.5% |
| Total civilian labor force, percent of population aged 16 and up, 2015-2019 : | 61.9% |
| Female labor force participation in the civilian labor force, as a percentage of the population aged 16 and up, 2015-2019 : | 58.2% |
| Total sales of lodging and food services in 2012 ($1,000) : | 11,057 |
| Total receipts/revenue for health care and social assistance in 2012 ($1,000) : | 79,279 |
| Manufacturers' total shipments in 2012 ($1,000) : | 116,000 |
| 2012 total retail sales ($1,000) : | 130,722 |
| 2012 total retail sales per capita : | $8,168 |
| Mean commute time to work (in minutes), workers aged 16 and up, 2015-2019 : | 31.2 |
| 2015-2019 median household income (in 2019 dollars) : | $57,163 |
| Income per capita in the previous 12 months (in 2019 dollars), 2015-2019 : | $28,427 |
| Percentage of people living in poverty : | 10.1% |
| Total number of employer establishments, 2019 : | 309 |
| 2019 total employment : | 3,178 |
| 2019 total annual payroll ($1,000) : | 134,586 |
| Total employment, change in percentage terms, 2018-2019 : | 4.8% |
| 2018 total non-employer establishments : | 983 |
| Total number of businesses in 2012 : | 1,245 |
| Men-owned businesses in 2012 : | 724 |
| Women-owned businesses in 2012 : | 333 |
| Minority-owned businesses in 2012 : | 41 |
| Non-minority-owned businesses in 2012 : | 1,167 |
| Veteran-owned businesses in 2012 : | 71 |
| Nonveteran-owned businesses in 2012 : | 1,064 |
| 2010 population per square mile : | 31.1 |
| 2010 land area in square miles : | 521.59 |
| Residential units, July 1, 2019 : | 7,061 |
| Rate of owner-occupied housing units, 2015-2019 : | 64.0% |
| Owner-occupied housing unit median value, 2015-2019 : | $91,100 |
| From 2015 to 2019, the median selected monthly owner costs - with a mortgage : | $1,145 |
| Monthly owner costs, without a mortgage, at the median, 2015-2019 : | $392 |
| 2015-2019 median gross rent : | $788 |
| Permits for construction, 2020 : | 2 |
| 2015-2019 Households : | 6,145 |
| Population per household, 2015-2019 : | 3.00 |
| Living in the same house a year ago, percentage of people aged one year and up, 2015-2019 : | 90.9% |
| Languages other than English spoken at home, as a percentage of people aged 5 and up, 2015-2019 : | 55.5% |
| Households with computers, %, 2015-2019 : | 86.2% |
| Percentage of households with a broadband Internet subscription, 2015-2019 : | 79.1% |
| Percentage of people aged 25 and up with a high school diploma or higher, 2015-2019 : | 73.8% |
| Bachelor's degree or higher, proportion of people aged 25 and up, 2015-2019 : | 12.0% |
| Percentage of people under the age of 65 who have a disability, 2015-2019 : | 6.5% |
| Persons under the age of 65 who do not have health insurance, as a percentage : | 26.2% |
| Total civilian labor force, percent of population aged 16 and up, 2015-2019 : | 65.4% |
| Female labor force participation in the civilian labor force, as a percentage of the population aged 16 and up, 2015-2019 : | 53.5% |
| Total receipts/revenue for health care and social assistance in 2012 ($1,000) : | 39,473 |
| Manufacturers' total shipments in 2012 ($1,000) : | 1,084,220 |
| 2012 total retail sales ($1,000) : | 275,814 |
| 2012 total retail sales per capita : | $14,247 |
| Mean commute time to work (in minutes), workers aged 16 and up, 2015-2019 : | 14.9 |
| 2015-2019 median household income (in 2019 dollars) : | $49,701 |
| Income per capita in the previous 12 months (in 2019 dollars), 2015-2019 : | $21,616 |
| Percentage of people living in poverty : | 17.0% |
| Total number of employer establishments, 2019 : | 374 |
| 2019 total employment : | 5,471 |
| 2019 total annual payroll ($1,000) : | 244,330 |
| Total employment, change in percentage terms, 2018-2019 : | 0.6% |
| 2018 total non-employer establishments : | 1,209 |
| Total number of businesses in 2012 : | 1,362 |
| Men-owned businesses in 2012 : | 799 |
| Women-owned businesses in 2012 : | 277 |
| Minority-owned businesses in 2012 : | 719 |
| Non-minority-owned businesses in 2012 : | 566 |
| Veteran-owned businesses in 2012 : | 55 |
| Nonveteran-owned businesses in 2012 : | 1,210 |
| 2010 population per square mile : | 12.9 |
| 2010 land area in square miles : | 1,496.87 |
Services and Civic Places in Browning
1Browning, Montana 59417
101 N Piegan St, Browning, MT 59417 View details
Phone: +14068887800 | Website available
2Browning City Hall
124 2nd Ave NW, Browning, MT 59417 View details
Phone: +14063382344 | Website available
3Blackfeet Land Department
Browning, MT 59417 View details
Phone: +14063382667 | Website available
4Blackfeet Personnel Department
Government Sq, Browning, MT 59417 View details
Phone: +14063387307 | Website available
People born in Browning (13)
People born in Browning, including Native writer James Welch, Blackfoot Native actor Steve Reevis, Cree artist, writer, and professor Alfred Young Man, .
More notable people
- Darrell Kipp (American historian, Blackfoot language teacher) he was born in 23/10/1944
- Joe Hipp (American boxer) he was born in 07/12/1962
- Frosty Boss Ribs (American politician) she was born in 12/04/1955
- Lea Whitford (American politician) she was born in 01/03/1966
- Albert Racine (Blackfoot artist) he was born in 19/04/1907
- Lily Gladstone (actor) she was born in 01/01/1986
- Tyson Runningwolf
- Rosalie Mae Jones (Native American dancer) she was born in 01/01/1941
- King Kuka (Blackfoot artist) he was born in 01/01/1946
- Neil Parsons (Blackfoot artist) he was born in 02/03/1938
Nearby Schools and Colleges
Schools and campuses linked to Browning, MT. Select a name to open its map and contact details.
| Code | Name | City | ZIP |
|---|---|---|---|
| 180054 | Blackfeet Community College | Browning (MT) | 59417-0819 |
Nearby Transit Stations (7)
Rail and bus stations connected to Browning, MT. Select a station to open its map and address details.
| Code | Name | Address | Type |
|---|---|---|---|
| BRO | Browning | Heart Butte Rd and Depot Rd. | RAIL |
| GPK | East Glacier Park | 400 Highway 49 North | RAIL |
| CUT | Cut Bank | 101 BNSF Industrial Site | RAIL |
| ESM | Essex | 290 Izaak Walton Inn Rd | RAIL |
| WGL | West Glacier | Hwy 2 and Going-to-the-Sun Rd. | RAIL |
Closest post offices linked to Browning.
| Post Office Name | City | ZIP |
|---|---|---|
| Browning Post Office | Browning (MT) | 59417 |
Other places with the same name (2)
- Browning, Missouri city in Missouri, United States with a population of 243 people.
- Browning, Illinois village in Illinois, United States with a population of 122 people.
Other cities in Glacier County
Cities, towns, neighborhoods & other populated places in Glacier County , MT.
| City Name | Population | Title |
|---|---|---|
| Cut Bank | 3,019 | City in Glacier County, Montana, United States |
| North Browning | 2,408 | Census designated place |
| South Browning | 1,785 | Town in Glacier County, Montana, United States |
Distance to Other Cities
Browning distances to largest Montana cities