Baltimore, Ohio
Baltimore: village in Ohio, United States
About
Baltimore is a village located in the county of Fairfield in the U.S. state of Ohio. Its population at the 2010 census was 2,966 and a population density of 523 people per km². After 10 years in 2020 city had an estimated population of 3,026 inhabitants.
The village was created 201 years ago in 1824.

Quick Facts about Baltimore
| Population | 3,026 (2020) |
| Country | United States of America |
| State | Ohio (United States) |
| County | Fairfield County |
| Area | 5.67 km2 |
| Latitude & Longitude | 39.8453,-82.6007 |
| Altitude | 863 feet / 263 meters |
| Establishment | January 01, 1825 (201 years ago) |
| Time Zone | Eastern Time Zone |
| Local time | 10:40:24 (24th July 2026) |
| Postal code | 43105 |
| Density | 534 Pop. per km² as of 2020 |
| Population growth | 1.98% (2010-2020) |
| Weather | 79℉ Partly Sunny 7-days weather |

Geography
Baltimore is located at 39°50'43"N 82°36'3"W (39.8453400, -82.6007200).
Baltimore map
Weather
Partly sunny, with a high near 79. East wind around 5 mph.
7-Day ForecastOfficial website of Baltimore
Official WebsiteDemographics
The population of Baltimore increased by 1.98% in 10 years.
| Year | Population | % Change | Method |
|---|---|---|---|
| 2010 | 2,966 | - | census |
| 2011 | 2,994 | 0.94% | estimation process |
| 2012 | 2,985 | -0.3% | estimation process |
| 2013 | 2,974 | -0.37% | estimation process |
| 2014 | 2,980 | 0.2% | estimation process |
| 2015 | 2,978 | -0.07% | estimation process |
| 2016 | 2,988 | 0.33% | estimation process |
| 2017 | 2,998 | 0.33% | estimation process |
| 2018 | 2,999 | 0.03% | estimation process |
| 2019 | 3,004 | 0.17% | estimation process |
| 2020 | 3,026 | 0.73% | estimation process |
Demographic Facts
| Estimated population as of July 1, 2019 : | 27,054 |
| Based on demographic estimates as of April 1, 2010 : | 29,242 |
| Based on demographic estimates as of 1 April 2010 : | -7.5% |
| April 1, 2020 Population : | 26,523 |
| April 1, 2010 Population : | 29,200 |
| People under 5 years old, percentage : | 7.0% |
| People under 18 years old, percentage : | 24.5% |
| People over 65 (%) : | 12.8% |
| Female persons, % : | 50.6% |
| White only, percent : | 75.7% |
| Black or African American alone, percent : | 15.3% |
| American Indian and Alaska Native only, % : | 0.8% |
| Asians alone % : | 0.5% |
| Only Native Hawaiians and Other Pacific Islanders, % : | 0.0% |
| % of people who have participated in two or more races : | 6.1% |
| % of Hispanic or Latino : | 5.4% |
| White people, not Hispanic or Latino people, make up the majority of the population. : | 73.0% |
| 2015-2019 Veterans : | 1,362 |
| Percentage of foreign-born people, 2015-2019 : | 2.6% |
| Rate of owner-occupied housing units, 2015-2019 : | 47.6% |
Economic Facts
| Rate of owner-occupied housing units, 2015-2019 : | 47.6% |
| Owner-occupied housing unit median value, 2015-2019 : | $74,500 |
| From 2015 to 2019, the median selected monthly owner costs - with a mortgage : | $959 |
| Monthly owner costs, without a mortgage, at the median, 2015-2019 : | $447 |
| 2015-2019 median gross rent : | $729 |
| 2015-2019 Households : | 9,717 |
| Population per household, 2015-2019 : | 2.47 |
| Living in the same house a year ago, percentage of people aged one year and up, 2015-2019 : | 86.5% |
| Languages other than English spoken at home, as a percentage of people aged 5 and up, 2015-2019 : | 4.7% |
| Households with computers, %, 2015-2019 : | 86.2% |
| Percentage of households with a broadband Internet subscription, 2015-2019 : | 77.0% |
| Percentage of people aged 25 and up with a high school diploma or higher, 2015-2019 : | 83.8% |
| Bachelor's degree or higher, proportion of people aged 25 and up, 2015-2019 : | 14.8% |
| Percentage of people under the age of 65 who have a disability, 2015-2019 : | 14.2% |
| Persons under the age of 65 who do not have health insurance, as a percentage : | 5.9% |
| Total civilian labor force, percent of population aged 16 and up, 2015-2019 : | 53.2% |
| Female labor force participation in the civilian labor force, as a percentage of the population aged 16 and up, 2015-2019 : | 55.3% |
| Total sales of lodging and food services in 2012 ($1,000) : | 42,669 |
| Total receipts/revenue for health care and social assistance in 2012 ($1,000) : | 475,147 |
| Manufacturers' total shipments in 2012 ($1,000) : | 385,576 |
| 2012 total retail sales ($1,000) : | 308,171 |
| 2012 total retail sales per capita : | $10,631 |
| Mean commute time to work (in minutes), workers aged 16 and up, 2015-2019 : | 19.4 |
| 2015-2019 median household income (in 2019 dollars) : | $36,909 |
| Income per capita in the previous 12 months (in 2019 dollars), 2015-2019 : | $18,207 |
| Percentage of people living in poverty : | 26.2% |
| Total number of businesses in 2012 : | 1,478 |
| Men-owned businesses in 2012 : | 655 |
| Women-owned businesses in 2012 : | 602 |
| Minority-owned businesses in 2012 : | 250 |
| Non-minority-owned businesses in 2012 : | 1,104 |
| Veteran-owned businesses in 2012 : | 177 |
| Nonveteran-owned businesses in 2012 : | 1,138 |
| 2010 population per square mile : | 4,028.2 |
| 2010 land area in square miles : | 7.25 |
| Rate of owner-occupied housing units, 2015-2019 : | 45.4% |
| Owner-occupied housing unit median value, 2015-2019 : | $177,500 |
| From 2015 to 2019, the median selected monthly owner costs - with a mortgage : | $1,738 |
| Monthly owner costs, without a mortgage, at the median, 2015-2019 : | $756 |
| 2015-2019 median gross rent : | $1,050 |
| 2015-2019 Households : | 9,088 |
| Population per household, 2015-2019 : | 2.46 |
| Living in the same house a year ago, percentage of people aged one year and up, 2015-2019 : | 82.4% |
| Languages other than English spoken at home, as a percentage of people aged 5 and up, 2015-2019 : | 17.0% |
| Households with computers, %, 2015-2019 : | 89.2% |
| Percentage of households with a broadband Internet subscription, 2015-2019 : | 83.2% |
| Percentage of people aged 25 and up with a high school diploma or higher, 2015-2019 : | 84.8% |
| Bachelor's degree or higher, proportion of people aged 25 and up, 2015-2019 : | 26.8% |
| Percentage of people under the age of 65 who have a disability, 2015-2019 : | 10.6% |
| Persons under the age of 65 who do not have health insurance, as a percentage : | 9.8% |
| Total civilian labor force, percent of population aged 16 and up, 2015-2019 : | 66.9% |
| Female labor force participation in the civilian labor force, as a percentage of the population aged 16 and up, 2015-2019 : | 64.4% |
| Total sales of lodging and food services in 2012 ($1,000) : | 69,851 |
| Total receipts/revenue for health care and social assistance in 2012 ($1,000) : | 392,727 |
| Manufacturers' total shipments in 2012 ($1,000) : | 334,258 |
| 2012 total retail sales ($1,000) : | 759,870 |
| 2012 total retail sales per capita : | $32,047 |
| Mean commute time to work (in minutes), workers aged 16 and up, 2015-2019 : | 22.5 |
| 2015-2019 median household income (in 2019 dollars) : | $51,299 |
| Income per capita in the previous 12 months (in 2019 dollars), 2015-2019 : | $27,716 |
| Percentage of people living in poverty : | 19.2% |
| Total number of businesses in 2012 : | 2,716 |
| Men-owned businesses in 2012 : | 1,428 |
| Women-owned businesses in 2012 : | 932 |
| Minority-owned businesses in 2012 : | 468 |
| Non-minority-owned businesses in 2012 : | 2,041 |
| Veteran-owned businesses in 2012 : | 177 |
| Nonveteran-owned businesses in 2012 : | 2,260 |
| 2010 population per square mile : | 3,191.5 |
| 2010 land area in square miles : | 7.49 |
Best Things to Do in Baltimore
1Smeck Park
7395 Basil Rd, Baltimore, OH 43105, United States View details
Phone: +17406817249 | Website available
2Johnson Park
220 Summers Choice Dr, Baltimore, OH 43105, United States View details
Phone: +17408624491 | Website available

3Baltimore Community Museum & Event Center
209 E Market St, Baltimore, OH 43105, United States View details
Phone: +17408623900 | Website available
4The L Experience
7079 Old Millersport Rd NE, Baltimore, OH 43105, United States View details
Where to Eat in Baltimore
1Subway
1055 W Market St, Baltimore, OH 43105, United States View details
Phone: +17408628990 | Website available

Services and Civic Places in Baltimore
1Baltimore Village Offices
103 W Market St, Baltimore, OH 43105 View details
Phone: +17408624491 | Website available
2Liberty Township Hall
2095 Reynoldsburg Baltimore Rd NW, Baltimore, OH 43105 View details
Phone: +17408626691 | Website available
People born in Baltimore (1)
American politician Mike McCormack was born in Baltimore
Nearby Schools and Colleges
Schools and campuses linked to Baltimore, OH. Select a name to open its map and contact details.
| Code | Name | City | ZIP |
|---|---|---|---|
| 204848 | Ohio University-Lancaster Campus | Lancaster (OH) | 43130-1037 |
Nearby Transit Stations (1)
Rail and bus stations connected to Baltimore, OH. Select a station to open its map and address details.
| Code | Name | Address | Type |
|---|---|---|---|
| COL | Columbus, OH | 111 East Town Street | BUS |
Closest post offices linked to Baltimore.
| Post Office Name | City | ZIP |
|---|---|---|
| Baltimor Post Office | Baltimore (OH) | 43105 |
Other places with the same name (2)
- Baltimore, Maryland The thirty-first most populous city in the United States and the center of the Baltimore metropolitan area. with a population of 586,131 people.
- Baltimore, Vermont town in Vermont, United States with a population of 244 people.
Other cities in Fairfield County
Cities, towns, neighborhoods & other populated places in Fairfield County , OH. (more)
| City Name | Population | Title |
|---|---|---|
| Lancaster | 40,932 | The county seat of Fairfield County, Ohio. |
| Pickerington | 22,835 | City in Fairfield and Franklin counties, Ohio, United States |
| Geneva | 5,899 | City in Ashtabula County, Ohio, United States |
| Waterloo | 2,605 | Human settlement in Ohio, United States |
| Carroll | 2,073 | Village in Fairfield County, Ohio, United States |
| Lithopolis | 1,916 | Human settlement in Ohio, United States of America |
| Jefferson | 1,821 | County in Ohio, United States |
| Bremen | 1,466 | Town in Ohio, United States |
| Royalton | 1,454 | Human settlement in Ohio, United States of America |
| Fairfield Beach | 1,292 | Census-designated place in Fairfield County, Ohio |
| Pleasant Hill | 1,258 | Human settlement in Miami County, Ohio, United States of America |
| Millersport | 1,081 | Human settlement in Fairfield County, Ohio, United States of America |
| Pleasantville | 963 | Village in Fairfield County, Ohio |
| Amanda | 746 | Town |
| Thurston | 607 | Place in Ohio |
| Stoutsville | 566 | Human settlement in Fairfield County, Ohio, United States of America |
Distance to Other Cities
Baltimore distances to largest Ohio cities
- Columbus
- Cleveland
- Cincinnati
- Toledo
- Akron
- Dayton
- Parma
- Lorain
- Youngstown
- West Chester
- Hamilton
- Colerain
Map & Images (more maps)
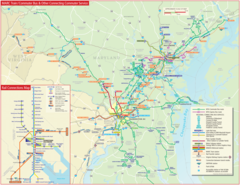
Baltimore Commuter Bus Map (link)
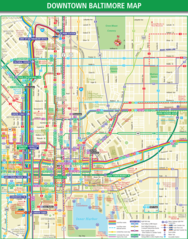
Baltimore Downtown Transport Map
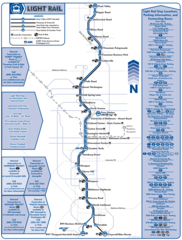
Baltimore Light Rail Map (tram)
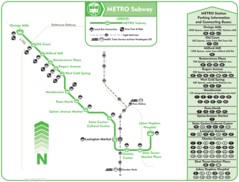
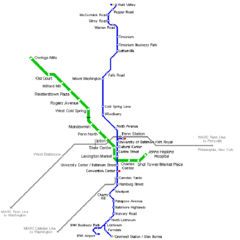
Baltimore Subway Map (metro)
Baltimore Transport Map