Bahamas (Commonwealth of The Bahamas), BS
Bahamas: This island nation in the Atlantic Ocean, southeast of the United States, is an archipelago renowned for its stunning beaches and vibrant coral reefs.
About

Country Snapshot
Commonwealth of The Bahamas at a glance
Commonwealth of The Bahamas currently has 6 quality-checked populated place pages and 19 state or regional pages linked on MapSof.
Mapped cities & towns
6
These counts use a stricter populated-place filter so the main lists stay focused on real city and town pages.
States & regions
19
Open related pagesLargest city
NassauPopulation 274,400
Top linked places
Quick Facts about Commonwealth of The Bahamas
| Population | 398,165 |
| Country | The Bahamas |
| Plate code | BS |
| Area | 13878 km2 |
| Official name | Bahamas, le Commonwealth des Bahamas, Commonwealth of the Bahamas |
| Has part | Samana Cay, Grand Bahama |
| Water as percent of area | 27.9% |
| Land as percent of area | 72.1% |
| Continent | North America |
| Easternmost point | Point(-72.908333333 22.375833333) |
| Northernmost point | Point(-78.35 27.25) |
| Latitude & Longitude | 25.0408,-77.3712 |
| Legislative body | Parliament of The Bahamas |
| Official language | English |
| Capital | Nassau |
| Establishment | January 01, 1973 (53 years ago) |
| Time Zone | UTC−05:00 |
| Local time | 15:18:14 (24th July 2026) |

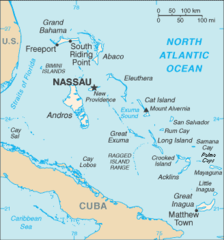
Geography
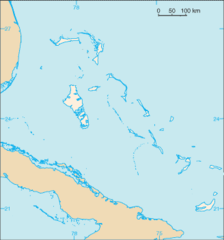
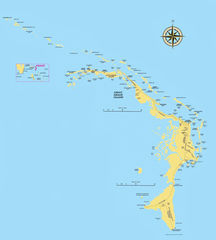
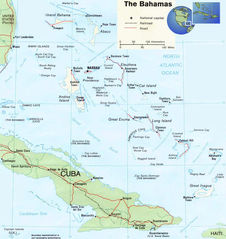
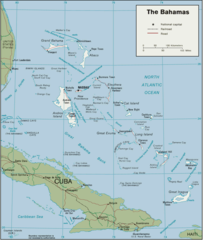
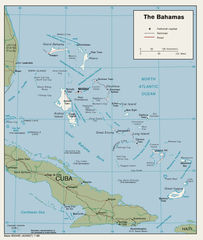
Commonwealth of The Bahamas is located at 25°2'27"N 77°22'16"W (25.0408200, -77.3712200).
Bahamas map
The largest city of Commonwealth of The Bahamas is Nassau with a population of 274,400. . See all Commonwealth of The Bahamas cities & populated places.
- Moore's Island
- Spanish Wells
- Inagua
- South Eleuthera
- Central Eleuthera
- Grand Cay
- Long Island
- Mangrove Cay
- Acklins
- North Abaco
- Hope Town
- East Grand Bahama
- Berry Islands
- New Providence
- Ragged Island
- South Abaco
- West Grand Bahama
- Harbour Island
- South Andros
- Crooked Island
- Bimini
- Freeport
- North Andros
- Black Point
- Central Andros
- Cat Island
- Exuma
- Rum Cay
- North Eleuthera
- Central Abaco
- Mayaguana
- San Salvador Island
Demographics
| Year | Population | % Change | Method |
|---|---|---|---|
| 1960 | 109,526 | - | resident registration |
| 1961 | 115,108 | 4.85% | resident registration |
| 1962 | 121,083 | 4.93% | resident registration |
| 1963 | 127,331 | 4.91% | resident registration |
| 1964 | 133,697 | 4.76% | resident registration |
| 1965 | 140,049 | 4.54% | resident registration |
| 1966 | 146,364 | 4.31% | resident registration |
| 1967 | 152,607 | 4.09% | resident registration |
| 1968 | 158,629 | 3.8% | resident registration |
| 1969 | 164,250 | 3.42% | resident registration |
| 1970 | 169,356 | 3.01% | resident registration |
| 1971 | 173,867 | 2.59% | resident registration |
| 1972 | 177,844 | 2.24% | resident registration |
| 1973 | 181,489 | 2.01% | resident registration |
| 1974 | 185,097 | 1.95% | resident registration |
| 1975 | 188,882 | 2% | resident registration |
| 1976 | 192,905 | 2.09% | resident registration |
| 1977 | 197,118 | 2.14% | resident registration |
| 1978 | 201,511 | 2.18% | resident registration |
| 1979 | 206,038 | 2.2% | resident registration |
| 1980 | 210,660 | 2.19% | resident registration |
| 1981 | 215,404 | 2.2% | resident registration |
| 1982 | 220,274 | 2.21% | resident registration |
| 1983 | 225,184 | 2.18% | resident registration |
| 1984 | 230,014 | 2.1% | resident registration |
| 1985 | 234,684 | 1.99% | resident registration |
| 1986 | 239,135 | 1.86% | resident registration |
| 1987 | 243,397 | 1.75% | resident registration |
| 1988 | 247,585 | 1.69% | resident registration |
| 1989 | 251,863 | 1.7% | resident registration |
| 1990 | 256,338 | 1.75% | resident registration |
| 1991 | 261,102 | 1.82% | resident registration |
| 1992 | 266,097 | 1.88% | resident registration |
| 1993 | 271,105 | 1.85% | resident registration |
| 1994 | 275,820 | 1.71% | resident registration |
| 1995 | 280,050 | 1.51% | resident registration |
| 1996 | 283,678 | 1.28% | resident registration |
| 1997 | 286,845 | 1.1% | resident registration |
| 1998 | 289,926 | 1.06% | resident registration |
| 1999 | 293,442 | 1.2% | resident registration |
| 2000 | 297,759 | 1.45% | resident registration |
| 2001 | 303,005 | 1.73% | resident registration |
| 2002 | 309,039 | 1.95% | resident registration |
| 2003 | 315,624 | 2.09% | resident registration |
| 2004 | 322,400 | 2.1% | resident registration |
| 2005 | 329,088 | 2.03% | resident registration |
| 2006 | 335,622 | 1.95% | resident registration |
| 2007 | 342,049 | 1.88% | resident registration |
| 2008 | 348,340 | 1.81% | resident registration |
| 2009 | 354,492 | 1.74% | resident registration |
| 2010 | 360,498 | 1.67% | resident registration |
| 2011 | 366,331 | 1.59% | resident registration |
| 2012 | 371,960 | 1.51% | resident registration |
| 2013 | 377,374 | 1.43% | resident registration |
| 2014 | 370,633 | -1.82% | (Worldbank) |
| 2015 | 374,206 | 0.95% | (Worldbank) |
| 2016 | 377,931 | 0.99% | (Worldbank) |
| 2017 | 395,361 | 4.41% | resident registration |
| 2018 | 385,640 | -2.52% | (Worldbank) |
| 2019 | 389,482 | 0.99% | (Worldbank) |
| 2026 | 398,165 | 2.18% |
Map & Images (more maps)
Bahamas Map Blank
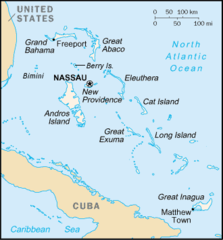
Bf Map Names Nw
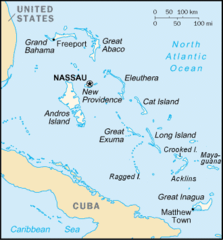
Bf Map Names Se
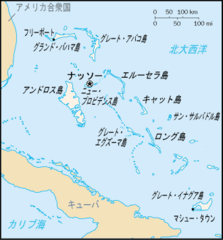
Bf Map Ja
Bf Map
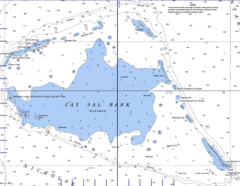
Caysal1
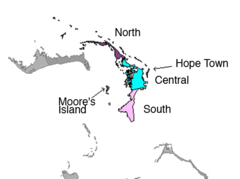
Districts of Abaco Bahamas
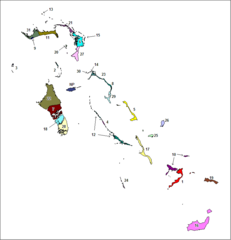
Districts of the Bahamas
Abaco Map
Bahamas Map
Bahamas Political Map
Bahamas Political Map 1

Grand Bahama Island
