Armenia (Republic of Armenia), AM
Armenia: This landlocked country in the South Caucasus region of Eurasia, at the crossroads of Western Asia and Eastern Europe, is known for its mountainous terrain and ancient history.
About

Country Snapshot
Republic of Armenia at a glance
Republic of Armenia currently has 177 quality-checked populated place pages and 11 state or regional pages linked on MapSof.
Mapped cities & towns
177
These counts use a stricter populated-place filter so the main lists stay focused on real city and town pages.
States & regions
11
Open related pagesLargest city
YerevanPopulation 1,075,800
Top linked places
Quick Facts about Republic of Armenia
| Population | 3,076,200 |
| Country | Armenia |
| Twitter username | armenia |
| Plate code | AM |
| Area | 29743.42 km2 |
| Official name | Հայաստան, Republik Armenien, la République d’Arménie, Ermənistan, Հայաստանի Հանրապետություն |
| Continent | Asia, Europe |
| Easternmost point | Point(46.63421983 39.23099254) |
| Northernmost point | Point(45.0 41.3) |
| Latitude & Longitude | 40.2500,45.0000 |
| Legislative body | National Assembly of Armenia |
| Official language | Armenian |
| Capital | Yerevan |
| Establishment | September 23, 1991 (34 years ago) |
| Time Zone | UTC+04:00, Armenia Time |
| Local time | 19:29:32 (24th July 2026) |

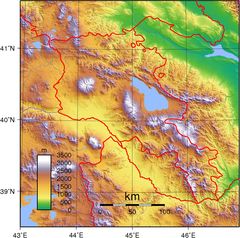
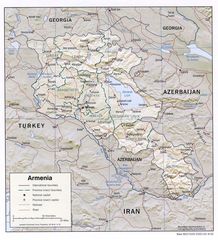
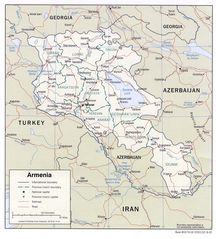
Geography
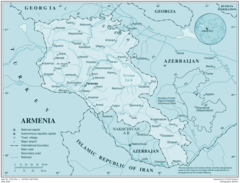
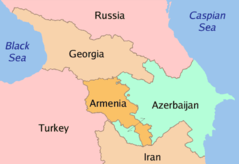
Republic of Armenia is located at 40°15'0"N 45°0'0"E (40.2500000, 45.0000000). It has 5 neighbors: Iran, Naxcivan Muxtar Respublikasi, Turkey, Azerbaijan and Georgia.
Armenia map
The largest city of Republic of Armenia is Yerevan with a population of 1,075,800. Other cities include, Vanadzor population 90,525, Vagharshapat population 56,388, Ararat population 28,832 and Artashat population 20,562. See all Republic of Armenia cities & populated places.
Compare Republic of Armenia with
- Tavush Region
- Syunik Province
- Lori Region
- Vayots Dzor Region
- Kotayk Province
- Armavir Region
- Yerevan
- Shirak Region
- Gegharkunik Province
- Aragatsotn Region
- Ararat Province
Demographics
| Year | Population | % Change | Method |
|---|---|---|---|
| 1960 | 1,867,396 | - | estimation process |
| 1961 | 1,934,239 | 3.46% | estimation process |
| 1962 | 2,002,170 | 3.39% | estimation process |
| 1963 | 2,070,427 | 3.3% | estimation process |
| 1964 | 2,138,133 | 3.17% | estimation process |
| 1965 | 2,204,650 | 3.02% | estimation process |
| 1966 | 2,269,475 | 2.86% | estimation process |
| 1967 | 2,332,624 | 2.71% | estimation process |
| 1968 | 2,394,635 | 2.59% | estimation process |
| 1969 | 2,456,370 | 2.51% | estimation process |
| 1970 | 2,518,408 | 2.46% | estimation process |
| 1971 | 2,580,894 | 2.42% | estimation process |
| 1972 | 2,643,464 | 2.37% | estimation process |
| 1973 | 2,705,584 | 2.3% | estimation process |
| 1974 | 2,766,495 | 2.2% | estimation process |
| 1975 | 2,825,650 | 2.09% | estimation process |
| 1976 | 2,882,831 | 1.98% | estimation process |
| 1977 | 2,938,181 | 1.88% | estimation process |
| 1978 | 2,991,954 | 1.8% | estimation process |
| 1979 | 3,044,564 | 1.73% | estimation process |
| 1980 | 3,096,298 | 1.67% | estimation process |
| 1981 | 3,145,885 | 1.58% | estimation process |
| 1982 | 3,192,877 | 1.47% | estimation process |
| 1983 | 3,239,212 | 1.43% | estimation process |
| 1984 | 3,287,588 | 1.47% | estimation process |
| 1985 | 3,339,147 | 1.54% | estimation process |
| 1986 | 3,396,511 | 1.69% | estimation process |
| 1987 | 3,457,054 | 1.75% | estimation process |
| 1988 | 3,510,439 | 1.52% | estimation process |
| 1989 | 3,542,720 | 0.91% | estimation process |
| 1990 | 3,544,695 | 0.06% | estimation process |
| 1991 | 3,511,912 | -0.93% | estimation process |
| 1992 | 3,449,497 | -1.81% | estimation process |
| 1993 | 3,369,673 | -2.37% | estimation process |
| 1994 | 3,289,943 | -2.42% | estimation process |
| 1995 | 3,223,173 | -2.07% | estimation process |
| 1996 | 3,173,425 | -1.57% | estimation process |
| 1997 | 3,137,652 | -1.14% | estimation process |
| 1998 | 3,112,958 | -0.79% | estimation process |
| 1999 | 3,093,820 | -0.62% | estimation process |
| 2000 | 3,076,098 | -0.58% | estimation process |
| 2001 | 3,059,960 | -0.53% | estimation process |
| 2002 | 3,047,002 | -0.43% | estimation process |
| 2003 | 3,036,032 | -0.36% | estimation process |
| 2004 | 3,025,652 | -0.34% | estimation process |
| 2005 | 3,014,917 | -0.36% | estimation process |
| 2006 | 3,002,911 | -0.4% | estimation process |
| 2007 | 2,989,882 | -0.44% | estimation process |
| 2008 | 2,977,488 | -0.42% | estimation process |
| 2009 | 2,968,154 | -0.31% | estimation process |
| 2010 | 2,963,496 | -0.16% | estimation process |
| 2011 | 2,964,120 | 0.02% | estimation process |
| 2012 | 2,969,081 | 0.17% | estimation process |
| 2013 | 2,976,566 | 0.25% | estimation process |
| 2014 | 2,912,403 | -2.2% | |
| 2015 | 2,925,553 | 0.45% | |
| 2016 | 2,936,146 | 0.36% | |
| 2017 | 2,930,450 | -0.19% | estimation process |
| 2018 | 2,951,776 | 0.72% | |
| 2019 | 2,957,731 | 0.2% | |
| 2026 | 3,076,200 | 3.85% |
Map & Images (more maps)
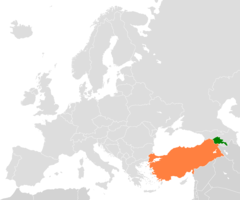
Armenia Turkey Locator 1
Armenianhighlandorg 1
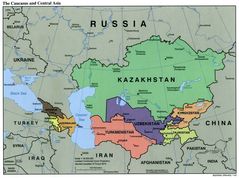
Caucasus Central Asia Political Map 2000 2
Caucasus Countries 1
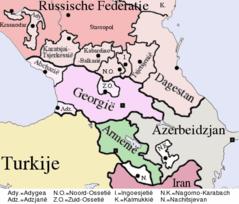
Caucasus Ethnic Religie 1
Kaukasus Politiek 1
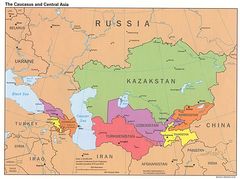
The Caucasus And Central Asia Political Map 2
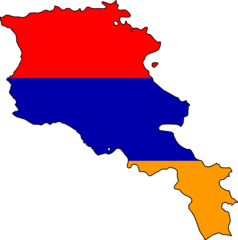
Armenia Flag Map
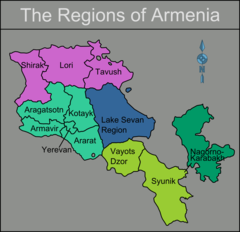
Armenia Regions Map
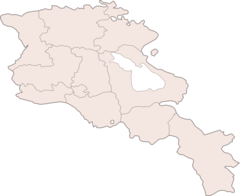
Armenia Blank Map
Armenia Map
Armenia Topography

Arshakuni Armenia 150
Armenia Physical Map
Armenia Political Map
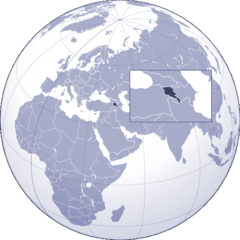
Where Is Armenia Located