Guyana (Co-operative Republic of Guyana), GY
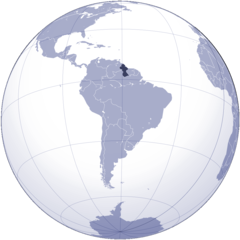
Guyana: This South American nation is situated on the continent's northern coast, bordered by the Atlantic Ocean to the east, Brazil to the south and southwest, Suriname to the east, and Venezuela to the west.
About

Country Snapshot
Co-operative Republic of Guyana at a glance
Co-operative Republic of Guyana currently has 6 quality-checked populated place pages and 9 state or regional pages linked on MapSof.
Mapped cities & towns
6
These counts use a stricter populated-place filter so the main lists stay focused on real city and town pages.
States & regions
9
Open related pagesLargest city
GeorgetownPopulation 200,500
Top linked places
Quick Facts about Co-operative Republic of Guyana
| Population | 772,975 |
| Country | Guyana |
| Plate code | GUY |
| Area | 214970 km2 |
| Official name | la République coopérative du Guyana, Co-operative Republic of Guyana, Guyana |
| Water as percent of area | 8.4% |
| Land as percent of area | 91.6% |
| Continent | South America |
| Easternmost point | Point(-56.49115 1.95864) |
| Northernmost point | Point(-59.98 8.53) |
| Latitude & Longitude | 5.0000,-59.0000 |
| Legislative body | National Assembly |
| Official language | English |
| Capital | Georgetown |
| Establishment | January 01, 1966 (60 years ago) |
| Time Zone | UTC−04:00 |
| Local time | 14:13:31 (20th June 2026) |

Geography
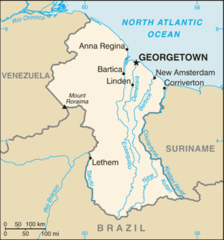
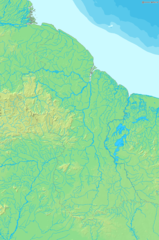
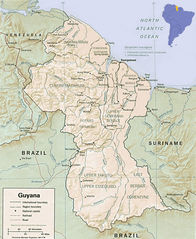
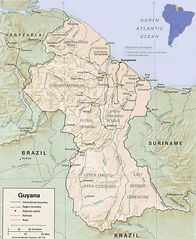
Co-operative Republic of Guyana is located at 5°0'0"N 59°0'0"W (5.0, -59.0). It has 3 neighbors: Suriname, Brazil and Venezuela.
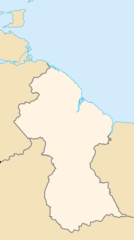
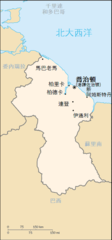
Guyana map
The largest city of Co-operative Republic of Guyana is Georgetown with a population of 200,500. Other cities include and Rosignol population 5,782. See all Co-operative Republic of Guyana cities & populated places.
Official website of Co-operative Republic of Guyana
Official WebsiteCompare Co-operative Republic of Guyana with
- Potaro-Siparuni
- East Berbice-Corentyne
- Mahaica-Berbice
- Barima-Waini
- Demerara-Mahaica
- Upper Demerara-Berbice
- Upper Takutu-Upper Essequibo
- Pomeroon-Supenaam
- Cuyuni-Mazaruni
- Essequibo Islands-West Demerara
Demographics
| Year | Population | % Change | Method |
|---|---|---|---|
| 1960 | 560,296 | - | census |
| 1961 | 575,976 | 2.72% | census |
| 1962 | 591,665 | 2.65% | census |
| 1963 | 607,528 | 2.61% | census |
| 1964 | 623,794 | 2.61% | census |
| 1965 | 640,541 | 2.61% | census |
| 1966 | 657,975 | 2.65% | census |
| 1967 | 675,811 | 2.64% | census |
| 1968 | 693,051 | 2.49% | census |
| 1969 | 708,356 | 2.16% | census |
| 1970 | 720,816 | 1.73% | census |
| 1971 | 729,872 | 1.24% | census |
| 1972 | 735,896 | 0.82% | census |
| 1973 | 740,041 | 0.56% | census |
| 1974 | 743,984 | 0.53% | census |
| 1975 | 748,877 | 0.65% | census |
| 1976 | 755,241 | 0.84% | census |
| 1977 | 762,549 | 0.96% | census |
| 1978 | 769,637 | 0.92% | census |
| 1979 | 774,818 | 0.67% | census |
| 1980 | 776,927 | 0.27% | census |
| 1981 | 775,662 | -0.16% | census |
| 1982 | 771,596 | -0.53% | census |
| 1983 | 765,512 | -0.79% | census |
| 1984 | 758,580 | -0.91% | census |
| 1985 | 751,720 | -0.91% | census |
| 1986 | 745,133 | -0.88% | census |
| 1987 | 738,779 | -0.86% | census |
| 1988 | 733,057 | -0.78% | census |
| 1989 | 728,382 | -0.64% | census |
| 1990 | 725,043 | -0.46% | census |
| 1991 | 723,259 | -0.25% | census |
| 1992 | 723,008 | -0.03% | census |
| 1993 | 724,014 | 0.14% | census |
| 1994 | 725,839 | 0.25% | census |
| 1995 | 728,136 | 0.32% | census |
| 1996 | 730,865 | 0.37% | census |
| 1997 | 734,059 | 0.44% | census |
| 1998 | 737,526 | 0.47% | census |
| 1999 | 741,046 | 0.48% | census |
| 2000 | 744,471 | 0.46% | census |
| 2001 | 747,657 | 0.43% | census |
| 2002 | 750,629 | 0.4% | census |
| 2003 | 753,612 | 0.4% | census |
| 2004 | 756,939 | 0.44% | census |
| 2005 | 760,834 | 0.51% | census |
| 2006 | 765,367 | 0.59% | census |
| 2007 | 770,407 | 0.65% | census |
| 2008 | 775,739 | 0.69% | census |
| 2009 | 781,055 | 0.68% | census |
| 2010 | 786,126 | 0.65% | census |
| 2011 | 790,882 | 0.6% | census |
| 2012 | 795,369 | 0.56% | census |
| 2013 | 799,613 | 0.53% | census |
| 2014 | 763,380 | -4.75% | (Worldbank) |
| 2015 | 767,432 | 0.53% | (Worldbank) |
| 2016 | 771,366 | 0.51% | (Worldbank) |
| 2017 | 777,859 | 0.83% | census |
| 2018 | 779,004 | 0.15% | (Worldbank) |
| 2019 | 782,766 | 0.48% | (Worldbank) |
| 2026 | 772,975 | -1.27% |
Map & Images (more maps)
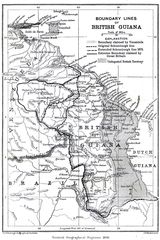
Boundary Lines of British Guiana 1896
Guayana Locator
Guianamap
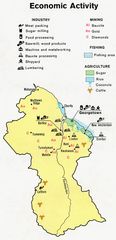
Guyana Econ 1973
Guyana Neighborhood Councils
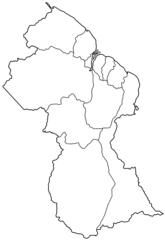
Guyana Regions Blank
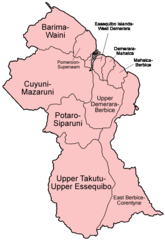
Guyana Regions English
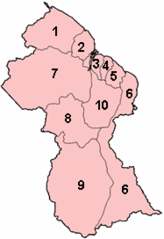
Guyana Regions Numbered (gina)
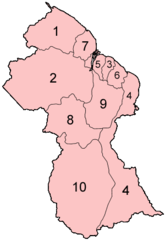
Guyana Regions Numbered
Guyana Rel 1991
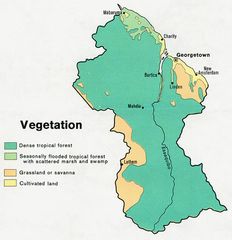
Guyana Veg 1973
Guyana Cia Wfb Map
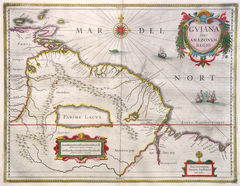
Janssonius Guyana And Parima Lacus
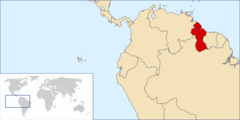
Locationguyana
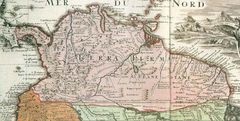
Map New Kingdom of Granada
Map of Guyana Demis

Guyana Flag Map
Guyana Map
Guyana Physical Map