Gays, Illinois
Gays: village in Moultrie County, Illinois
About
Gays is a village located in the county of Moultrie in the U.S. state of Illinois. Its population at the 2010 census was 281 and a population density of 685 people per km². After 10 years in 2020 city had an estimated population of 252 inhabitants.
Quick Facts about Gays
| Population | 252 (2020) |
| Country | United States of America |
| State | Illinois (United States) |
| County | Moultrie County |
| Postal code | 61928 |
| Area | 0.41 km2 |
| Latitude & Longitude | 39.4581,-88.4939 |
| Altitude | 2,470 feet / 753 meters |
| Time Zone | America/Chicago |
| Local time | 04:56:43 (27th June 2026) |
| Density | 615 Pop. per km² as of 2020 |
| Population growth | -11.51% (2010-2020) |
| Weather | 82℉ Chance Showers And Thunderstorms 7-days weather |
Geography
Gays is located at 39°27'29"N 88°29'38"W (39.4580900, -88.4939400).
Gays map
Weather
A chance of showers and thunderstorms. Partly sunny, with a high near 82. South wind around 5 mph. Chance of precipitation is 50%. New rainfall amount...
7-Day ForecastDemographics
According to census records, the population of Gays decreased by 11.51% in 10 years.
| Year | Population | % Change | Method |
|---|---|---|---|
| 2010 | 281 | - | census |
| 2011 | 280 | -0.36% | estimation process |
| 2012 | 276 | -1.45% | estimation process |
| 2013 | 274 | -0.73% | estimation process |
| 2014 | 272 | -0.74% | estimation process |
| 2015 | 270 | -0.74% | estimation process |
| 2016 | 263 | -2.66% | estimation process |
| 2017 | 264 | 0.38% | estimation process |
| 2018 | 261 | -1.15% | estimation process |
| 2019 | 254 | -2.76% | estimation process |
| 2020 | 252 | -0.79% | estimation process |
Demographic Facts
| Estimated population as of July 1, 2019 : | 25,658 |
| Based on demographic estimates as of April 1, 2010 : | 24,306 |
| Based on demographic estimates as of 1 April 2010 : | 5.6% |
| April 1, 2020 Population : | 25,227 |
| April 1, 2010 Population : | 24,194 |
| People under 5 years old, percentage : | 9.8% |
| People under 18 years old, percentage : | 31.4% |
| People over 65 (%) : | 12.2% |
| Female persons, % : | 49.6% |
| White only, percent : | 75.2% |
| Black or African American alone, percent : | 1.2% |
| American Indian and Alaska Native only, % : | 1.0% |
| Asians alone % : | 3.5% |
| Only Native Hawaiians and Other Pacific Islanders, % : | 0.1% |
| % of people who have participated in two or more races : | 5.2% |
| % of Hispanic or Latino : | 77.9% |
| White people, not Hispanic or Latino people, make up the majority of the population. : | 14.3% |
| 2015-2019 Veterans : | 771 |
| Percentage of foreign-born people, 2015-2019 : | 32.3% |
| Rate of owner-occupied housing units, 2015-2019 : | 62.9% |
Economic Facts
| Rate of owner-occupied housing units, 2015-2019 : | 62.9% |
| Owner-occupied housing unit median value, 2015-2019 : | $207,500 |
| From 2015 to 2019, the median selected monthly owner costs - with a mortgage : | $1,349 |
| Monthly owner costs, without a mortgage, at the median, 2015-2019 : | $461 |
| 2015-2019 median gross rent : | $960 |
| 2015-2019 Households : | 7,044 |
| Population per household, 2015-2019 : | 3.59 |
| Living in the same house a year ago, percentage of people aged one year and up, 2015-2019 : | 91.7% |
| Languages other than English spoken at home, as a percentage of people aged 5 and up, 2015-2019 : | 65.7% |
| Households with computers, %, 2015-2019 : | 88.6% |
| Percentage of households with a broadband Internet subscription, 2015-2019 : | 68.9% |
| Percentage of people aged 25 and up with a high school diploma or higher, 2015-2019 : | 63.0% |
| Bachelor's degree or higher, proportion of people aged 25 and up, 2015-2019 : | 12.7% |
| Percentage of people under the age of 65 who have a disability, 2015-2019 : | 7.8% |
| Persons under the age of 65 who do not have health insurance, as a percentage : | 11.0% |
| Total civilian labor force, percent of population aged 16 and up, 2015-2019 : | 60.2% |
| Female labor force participation in the civilian labor force, as a percentage of the population aged 16 and up, 2015-2019 : | 55.2% |
| Total receipts/revenue for health care and social assistance in 2012 ($1,000) : | 109,063 |
| Manufacturers' total shipments in 2012 ($1,000) : | 80,882 |
| 2012 total retail sales ($1,000) : | 146,616 |
| 2012 total retail sales per capita : | $5,902 |
| Mean commute time to work (in minutes), workers aged 16 and up, 2015-2019 : | 23.9 |
| 2015-2019 median household income (in 2019 dollars) : | $46,490 |
| Income per capita in the previous 12 months (in 2019 dollars), 2015-2019 : | $17,423 |
| Percentage of people living in poverty : | 21.1% |
| Total number of businesses in 2012 : | 1,169 |
| Men-owned businesses in 2012 : | 489 |
| Women-owned businesses in 2012 : | 454 |
| Minority-owned businesses in 2012 : | 602 |
| Non-minority-owned businesses in 2012 : | 466 |
| Veteran-owned businesses in 2012 : | 38 |
| Nonveteran-owned businesses in 2012 : | 1,002 |
| 2010 population per square mile : | 4,759.2 |
| 2010 land area in square miles : | 5.08 |
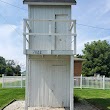
Best Things to Do in Gays
1Two Story Outhouse
1022 S Pine St, Gays, IL 61928, United States View details
Nearby Schools and Colleges
Schools and campuses linked to Gays, IL. Select a name to open its map and contact details.
| Code | Name | City | ZIP |
|---|---|---|---|
| 146506 | Lake Land College | Mattoon (IL) | 61938 |
Nearby Transit Stations (8)
Rail and bus stations connected to Gays, IL. Select a station to open its map and address details.
| Code | Name | Address | Type |
|---|---|---|---|
| MAT | Mattoon station | 1718 Broadway Ave. | RAIL |
| EFG | Effingham | 401 West National Ave. | RAIL |
| CHM | Illinois Terminal | 45 East University Ave. | RAIL |
| RTL | Rantoul | West Sangamon and North Kentucky Aves. | RAIL |
| DVI | Danville, Illinois | 379 Lynch Road | BUS |
Closest post offices linked to Gays.
| Post Office Name | City | ZIP |
|---|---|---|
| Windsor Post Office | Windsor (IL) | 61957 |
Other cities in Moultrie County
Cities, towns, neighborhoods & other populated places in Moultrie County , IL.
| City Name | Population | Title |
|---|---|---|
| Bruce | 12,209 | Unincorporated community in Illinois |
| Sullivan | 4,400 | City in Illinois |
| Bethany | 1,210 | Village in Illinois, United States |
| Lovington | 1,010 | Township in Moultrie County, Illinois |
| Dalton City | 494 | Village in Illinois, USA |
| Allenville | 141 | Human settlement in the United States of America |