Frederica, Delaware
Frederica: town in Delaware, United States
About
Frederica is a town located in the county of Kent in the U.S. state of Delaware. Its population at the 2010 census was 774 and a population density of 155 people per km². After 10 years in 2020 city had an estimated population of 859 inhabitants.

Quick Facts about Frederica
| Population | 859 (2020) |
| Country | United States of America |
| State | Delaware (United States) |
| County | Kent County |
| Postal code | 19946 |
| Phone Area Codes | 302 |
| Area | 4.98 km2 |
| Water as percent of area | 0% |
| Land as percent of area | 100% |
| Latitude & Longitude | 39.0090,-75.4658 |
| Altitude | 16 feet / 5 meters |
| Time Zone | America/New_York |
| Local time | 05:23:19 (27th June 2026) |
| Density | 173 Pop. per km² as of 2020 |
| Population growth | 9.9% (2010-2020) |
| Weather | 82℉ Showers And Thunderstorms 7-days weather |

Geography
Frederica is located at 39°0'32"N 75°27'57"W (39.0090000, -75.4657500).
Frederica map
Weather
Showers and thunderstorms. Mostly cloudy, with a high near 82. East wind 0 to 5 mph. Chance of precipitation is 80%. New rainfall amounts between a te...
7-Day ForecastOfficial website of Frederica
Official WebsiteDemographics
The population of Frederica increased by 9.9% in 10 years.
| Year | Population | % Change | Method |
|---|---|---|---|
| 2010 | 774 | - | census |
| 2011 | 771 | -0.39% | estimation process |
| 2012 | 782 | 1.41% | estimation process |
| 2013 | 790 | 1.01% | estimation process |
| 2014 | 803 | 1.62% | estimation process |
| 2015 | 813 | 1.23% | estimation process |
| 2016 | 820 | 0.85% | estimation process |
| 2017 | 829 | 1.09% | estimation process |
| 2018 | 837 | 0.96% | estimation process |
| 2019 | 849 | 1.41% | estimation process |
| 2020 | 859 | 1.16% | estimation process |
Demographic Facts
| Estimated population as of July 1, 2019 : | 11,403 |
| Based on demographic estimates as of April 1, 2010 : | 11,793 |
| Based on demographic estimates as of 1 April 2010 : | -3.3% |
| April 1, 2020 Population : | 11,709 |
| April 1, 2010 Population : | 11,793 |
| People under 5 years old, percentage : | 6.8% |
| People under 18 years old, percentage : | 22.7% |
| People over 65 (%) : | 14.2% |
| Female persons, % : | 49.1% |
| White only, percent : | 79.2% |
| Black or African American alone, percent : | 2.2% |
| American Indian and Alaska Native only, % : | 0.7% |
| Asians alone % : | 5.4% |
| Only Native Hawaiians and Other Pacific Islanders, % : | 0.0% |
| % of people who have participated in two or more races : | 1.0% |
| % of Hispanic or Latino : | 29.8% |
| White people, not Hispanic or Latino people, make up the majority of the population. : | 62.1% |
| 2015-2019 Veterans : | 380 |
| Percentage of foreign-born people, 2015-2019 : | 46.7% |
| Rate of owner-occupied housing units, 2015-2019 : | 58.9% |
Economic Facts
| Rate of owner-occupied housing units, 2015-2019 : | 58.9% |
| Owner-occupied housing unit median value, 2015-2019 : | $203,200 |
| From 2015 to 2019, the median selected monthly owner costs - with a mortgage : | $1,735 |
| Monthly owner costs, without a mortgage, at the median, 2015-2019 : | $715 |
| 2015-2019 median gross rent : | $1,031 |
| 2015-2019 Households : | 4,304 |
| Population per household, 2015-2019 : | 2.70 |
| Living in the same house a year ago, percentage of people aged one year and up, 2015-2019 : | 89.7% |
| Languages other than English spoken at home, as a percentage of people aged 5 and up, 2015-2019 : | 68.4% |
| Households with computers, %, 2015-2019 : | 84.3% |
| Percentage of households with a broadband Internet subscription, 2015-2019 : | 72.5% |
| Percentage of people aged 25 and up with a high school diploma or higher, 2015-2019 : | 85.4% |
| Bachelor's degree or higher, proportion of people aged 25 and up, 2015-2019 : | 19.0% |
| Percentage of people under the age of 65 who have a disability, 2015-2019 : | 5.1% |
| Persons under the age of 65 who do not have health insurance, as a percentage : | 16.1% |
| Total civilian labor force, percent of population aged 16 and up, 2015-2019 : | 66.8% |
| Female labor force participation in the civilian labor force, as a percentage of the population aged 16 and up, 2015-2019 : | 60.8% |
| Total sales of lodging and food services in 2012 ($1,000) : | 122,663 |
| Total receipts/revenue for health care and social assistance in 2012 ($1,000) : | 25,319 |
| Manufacturers' total shipments in 2012 ($1,000) : | 502,877 |
| 2012 total retail sales ($1,000) : | 143,835 |
| 2012 total retail sales per capita : | $12,130 |
| Mean commute time to work (in minutes), workers aged 16 and up, 2015-2019 : | 29.6 |
| 2015-2019 median household income (in 2019 dollars) : | $54,099 |
| Income per capita in the previous 12 months (in 2019 dollars), 2015-2019 : | $25,324 |
| Percentage of people living in poverty : | 15.9% |
| Total number of businesses in 2012 : | 2,392 |
| Men-owned businesses in 2012 : | 1,612 |
| Women-owned businesses in 2012 : | 639 |
| Minority-owned businesses in 2012 : | 404 |
| Non-minority-owned businesses in 2012 : | 1,935 |
| Veteran-owned businesses in 2012 : | 181 |
| Nonveteran-owned businesses in 2012 : | 2,158 |
| 2010 population per square mile : | 4,259.2 |
| 2010 land area in square miles : | 2.77 |
Best Things to Do in Frederica
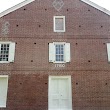
1Barratt's Chapel & Museum
6362 Bay Rd, Frederica, DE 19946, United States View details
Phone: +13023355544 | Website available
Services and Civic Places in Frederica
1Frederica Town Hall
2 W David St, Frederica, DE 19946 View details
Phone: +13023355417 | Website available

People born in Frederica (2)
People born in Frederica, including politician John W. Hall, politician Albert Fawcett Polk, .
More notable people
Nearby Schools and Colleges
Schools and campuses linked to Frederica, DE. Select a name to open its map and contact details.
| Code | Name | City | ZIP |
|---|---|---|---|
| 491473 | Polytech Adult Education | Woodside (DE) | 19980-0000 |
Nearby Transit Stations (29)
Rail and bus stations connected to Frederica, DE. Select a station to open its map and address details.
| Code | Name | Address | Type |
|---|---|---|---|
| DVR | Dover, Delaware | 716 South Governors Ave | BUS |
| ESN | Easton Airport, Maryland | 29137 Newman Road | BUS |
| KNT | Kent Island, MD | 3206 Main Street | BUS |
| CDE | Cambridge, Maryland | 100 Heron Boulevard | BUS |
| SLY | Salisbury, Maryland | 350 Cypress St. | BUS |
Closest post offices linked to Frederica.
| Post Office Name | City | ZIP |
|---|---|---|
| Frederica Post Office | Frederica (DE) | 19946 |
Other cities in Kent County
Cities, towns, neighborhoods & other populated places in Kent County , DE. (more)
| City Name | Population | Title |
|---|---|---|
| Dover | 38,199 | City in and county seat of Kent County, Delaware, United States, and capital city of Delaware |
| Smyrna | 12,163 | Town in Delaware |
| Harrington | 3,663 | City in Delaware, United States |
| Camden | 3,640 | Town in Delaware, United States |
| Clayton | 3,630 | Town in Delaware, United States |
| Highland Acres | 3,459 | Census designated place |
| Kent Acres | 1,890 | Census designated place |
| Cheswold | 1,759 | Town in Kent County, Delaware, United States |
| Wyoming | 1,657 | Town in Delaware, United States |
| Rodney Village | 1,487 | Census-designated place in Delaware |
| Felton | 1,432 | Town of the United States |
| Houston | 409 | Town in Delaware |
| Magnolia | 293 | Town of the United States |
| Kenton | 275 | Town in Kent County, Delaware, United States |
| Little Creek | 239 | Town of the United States |
| Bethel | 211 | Town in Sussex County, Delaware, USA |