Frankfort, Illinois
Frankfort: county seat city in Franklin County, Kentucky, USA and Kentucky federated state capital city
About
Frankfort is a city located in the county of Franklin in the U.S. state of Illinois. Its population at the 2010 census was 17,782 and a population density of 456 people per km². After 10 years in 2020 city had an estimated population of 19,411 inhabitants.
The city was created 240 years ago in 1785.

Quick Facts about Frankfort
| Population | 19,411 (2020) |
| Country | United States of America |
| State | Illinois (United States) |
| County | Franklin County |
| Phone Area Codes | 502 |
| Area | 39.03 km2 |
| Latitude & Longitude | 37.9001,-88.9023 |
| Altitude | 509 feet / 155 meters |
| Capital city | Frankfort is capital of Kentucky, Franklin County |
| Establishment | January 01, 1786 (240 years ago) |
| Time Zone | Eastern Time Zone |
| Local time | 05:25:24 (18th July 2026) |
| Postal code | 60423 |
| Density | 497 Pop. per km² as of 2020 |
| Population growth | 8.39% (2010-2020) |
| Weather | 94℉ Sunny then Chance Showers And Thunderstorms 7-days weather |

Geography
Frankfort is located at 37°54'0"N 88°54'8"W (37.9000500, -88.9022900).
Frankfort map
Weather
A chance of showers and thunderstorms after 3pm. Sunny, with a high near 94. West wind 3 to 9 mph. Chance of precipitation is 30%.
7-Day ForecastOfficial website of Frankfort
Official WebsiteDemographics
The population of Frankfort increased by 8.39% in 10 years.
| Year | Population | % Change | Method |
|---|---|---|---|
| 2010 | 17,782 | - | census |
| 2011 | 17,925 | 0.8% | estimation process |
| 2012 | 18,031 | 0.59% | estimation process |
| 2013 | 18,168 | 0.75% | estimation process |
| 2014 | 18,397 | 1.24% | estimation process |
| 2015 | 18,615 | 1.17% | estimation process |
| 2016 | 18,820 | 1.09% | estimation process |
| 2017 | 18,955 | 0.71% | estimation process |
| 2018 | 19,121 | 0.87% | estimation process |
| 2019 | 19,341 | 1.14% | estimation process |
| 2020 | 19,411 | 0.36% | estimation process |
Demographic Facts
| Estimated population as of July 1, 2019 : | 59,599 |
| Based on demographic estimates as of April 1, 2010 : | 58,104 |
| Based on demographic estimates as of 1 April 2010 : | 2.6% |
| April 1, 2020 Population : | 62,623 |
| April 1, 2010 Population : | 54,165 |
| People under 5 years old, percentage : | 7.6% |
| People under 18 years old, percentage : | 31.2% |
| People over 65 (%) : | 11.6% |
| Female persons, % : | 49.5% |
| White only, percent : | 73.4% |
| Black or African American alone, percent : | 0.6% |
| American Indian and Alaska Native only, % : | 1.1% |
| Asians alone % : | 5.0% |
| Only Native Hawaiians and Other Pacific Islanders, % : | 0.4% |
| % of people who have participated in two or more races : | 3.8% |
| % of Hispanic or Latino : | 65.6% |
| White people, not Hispanic or Latino people, make up the majority of the population. : | 25.6% |
| 2015-2019 Veterans : | 1,998 |
| Percentage of foreign-born people, 2015-2019 : | 22.4% |
| Rate of owner-occupied housing units, 2015-2019 : | 51.6% |
Economic Facts
| Rate of owner-occupied housing units, 2015-2019 : | 51.6% |
| Owner-occupied housing unit median value, 2015-2019 : | $172,500 |
| From 2015 to 2019, the median selected monthly owner costs - with a mortgage : | $1,247 |
| Monthly owner costs, without a mortgage, at the median, 2015-2019 : | $413 |
| 2015-2019 median gross rent : | $941 |
| 2015-2019 Households : | 17,227 |
| Population per household, 2015-2019 : | 3.39 |
| Living in the same house a year ago, percentage of people aged one year and up, 2015-2019 : | 86.0% |
| Languages other than English spoken at home, as a percentage of people aged 5 and up, 2015-2019 : | 53.8% |
| Households with computers, %, 2015-2019 : | 86.3% |
| Percentage of households with a broadband Internet subscription, 2015-2019 : | 78.9% |
| Percentage of people aged 25 and up with a high school diploma or higher, 2015-2019 : | 70.2% |
| Bachelor's degree or higher, proportion of people aged 25 and up, 2015-2019 : | 11.5% |
| Percentage of people under the age of 65 who have a disability, 2015-2019 : | 8.1% |
| Persons under the age of 65 who do not have health insurance, as a percentage : | 8.3% |
| Total civilian labor force, percent of population aged 16 and up, 2015-2019 : | 57.7% |
| Female labor force participation in the civilian labor force, as a percentage of the population aged 16 and up, 2015-2019 : | 51.5% |
| Total sales of lodging and food services in 2012 ($1,000) : | 60,035 |
| Total receipts/revenue for health care and social assistance in 2012 ($1,000) : | 287,150 |
| Manufacturers' total shipments in 2012 ($1,000) : | 312,006 |
| 2012 total retail sales ($1,000) : | 513,658 |
| 2012 total retail sales per capita : | $9,335 |
| Mean commute time to work (in minutes), workers aged 16 and up, 2015-2019 : | 23.3 |
| 2015-2019 median household income (in 2019 dollars) : | $43,823 |
| Income per capita in the previous 12 months (in 2019 dollars), 2015-2019 : | $18,250 |
| Percentage of people living in poverty : | 27.5% |
| Total number of businesses in 2012 : | 2,976 |
| Men-owned businesses in 2012 : | 1,517 |
| Women-owned businesses in 2012 : | 1,123 |
| Minority-owned businesses in 2012 : | 1,684 |
| Non-minority-owned businesses in 2012 : | 1,144 |
| Veteran-owned businesses in 2012 : | 263 |
| Nonveteran-owned businesses in 2012 : | 2,535 |
| 2010 population per square mile : | 3,076.3 |
| 2010 land area in square miles : | 17.61 |
| Rate of owner-occupied housing units, 2015-2019 : | 76.5% |
| Owner-occupied housing unit median value, 2015-2019 : | $420,000 |
| From 2015 to 2019, the median selected monthly owner costs - with a mortgage : | $2,173 |
| Monthly owner costs, without a mortgage, at the median, 2015-2019 : | $538 |
| 2015-2019 median gross rent : | $1,610 |
| 2015-2019 Households : | 18,879 |
| Population per household, 2015-2019 : | 2.88 |
| Living in the same house a year ago, percentage of people aged one year and up, 2015-2019 : | 82.3% |
| Languages other than English spoken at home, as a percentage of people aged 5 and up, 2015-2019 : | 10.1% |
| Households with computers, %, 2015-2019 : | 98.9% |
| Percentage of households with a broadband Internet subscription, 2015-2019 : | 96.0% |
| Percentage of people aged 25 and up with a high school diploma or higher, 2015-2019 : | 97.4% |
| Bachelor's degree or higher, proportion of people aged 25 and up, 2015-2019 : | 53.2% |
| Percentage of people under the age of 65 who have a disability, 2015-2019 : | 3.8% |
| Persons under the age of 65 who do not have health insurance, as a percentage : | 3.9% |
| Total civilian labor force, percent of population aged 16 and up, 2015-2019 : | 77.2% |
| Female labor force participation in the civilian labor force, as a percentage of the population aged 16 and up, 2015-2019 : | 70.3% |
| Total sales of lodging and food services in 2012 ($1,000) : | 101,361 |
| Total receipts/revenue for health care and social assistance in 2012 ($1,000) : | 279,689 |
| 2012 total retail sales ($1,000) : | 837,481 |
| 2012 total retail sales per capita : | $17,755 |
| Mean commute time to work (in minutes), workers aged 16 and up, 2015-2019 : | 26.7 |
| 2015-2019 median household income (in 2019 dollars) : | $110,934 |
| Income per capita in the previous 12 months (in 2019 dollars), 2015-2019 : | $44,527 |
| Percentage of people living in poverty : | 3.3% |
| Total number of businesses in 2012 : | 4,291 |
| Men-owned businesses in 2012 : | 2,128 |
| Women-owned businesses in 2012 : | 1,564 |
| Minority-owned businesses in 2012 : | 443 |
| Non-minority-owned businesses in 2012 : | 3,689 |
| Veteran-owned businesses in 2012 : | 368 |
| Nonveteran-owned businesses in 2012 : | 3,668 |
| 2010 population per square mile : | 2,212.3 |
| 2010 land area in square miles : | 20.48 |
| Rate of owner-occupied housing units, 2015-2019 : | 72.4% |
| Owner-occupied housing unit median value, 2015-2019 : | $319,500 |
| From 2015 to 2019, the median selected monthly owner costs - with a mortgage : | $2,159 |
| Monthly owner costs, without a mortgage, at the median, 2015-2019 : | $925 |
| 2015-2019 median gross rent : | $1,277 |
| 2015-2019 Households : | 3,740 |
| Population per household, 2015-2019 : | 2.43 |
| Living in the same house a year ago, percentage of people aged one year and up, 2015-2019 : | 87.9% |
| Languages other than English spoken at home, as a percentage of people aged 5 and up, 2015-2019 : | 22.6% |
| Households with computers, %, 2015-2019 : | 94.7% |
| Percentage of households with a broadband Internet subscription, 2015-2019 : | 91.0% |
| Percentage of people aged 25 and up with a high school diploma or higher, 2015-2019 : | 95.1% |
| Bachelor's degree or higher, proportion of people aged 25 and up, 2015-2019 : | 39.7% |
| Percentage of people under the age of 65 who have a disability, 2015-2019 : | 4.3% |
| Persons under the age of 65 who do not have health insurance, as a percentage : | 3.7% |
| Total civilian labor force, percent of population aged 16 and up, 2015-2019 : | 74.3% |
| Female labor force participation in the civilian labor force, as a percentage of the population aged 16 and up, 2015-2019 : | 69.5% |
| Total sales of lodging and food services in 2012 ($1,000) : | 77,475 |
| Total receipts/revenue for health care and social assistance in 2012 ($1,000) : | 79,506 |
| Manufacturers' total shipments in 2012 ($1,000) : | 797,714 |
| 2012 total retail sales ($1,000) : | 75,212 |
| 2012 total retail sales per capita : | $8,572 |
| Mean commute time to work (in minutes), workers aged 16 and up, 2015-2019 : | 26.3 |
| 2015-2019 median household income (in 2019 dollars) : | $93,958 |
| Income per capita in the previous 12 months (in 2019 dollars), 2015-2019 : | $45,781 |
| Percentage of people living in poverty : | 4.7% |
| Total number of businesses in 2012 : | 1,331 |
| Men-owned businesses in 2012 : | 788 |
| Women-owned businesses in 2012 : | 254 |
| Minority-owned businesses in 2012 : | 202 |
| Non-minority-owned businesses in 2012 : | 914 |
| Veteran-owned businesses in 2012 : | 47 |
| Nonveteran-owned businesses in 2012 : | 1,071 |
| 2010 population per square mile : | 1,746.8 |
| 2010 land area in square miles : | 4.95 |
| Rate of owner-occupied housing units, 2015-2019 : | 65.4% |
| Owner-occupied housing unit median value, 2015-2019 : | $129,900 |
| From 2015 to 2019, the median selected monthly owner costs - with a mortgage : | $1,401 |
| Monthly owner costs, without a mortgage, at the median, 2015-2019 : | $634 |
| 2015-2019 median gross rent : | $1,004 |
| 2015-2019 Households : | 10,873 |
| Population per household, 2015-2019 : | 2.56 |
| Living in the same house a year ago, percentage of people aged one year and up, 2015-2019 : | 87.8% |
| Languages other than English spoken at home, as a percentage of people aged 5 and up, 2015-2019 : | 17.9% |
| Households with computers, %, 2015-2019 : | 90.3% |
| Percentage of households with a broadband Internet subscription, 2015-2019 : | 82.5% |
| Percentage of people aged 25 and up with a high school diploma or higher, 2015-2019 : | 91.1% |
| Bachelor's degree or higher, proportion of people aged 25 and up, 2015-2019 : | 24.3% |
| Percentage of people under the age of 65 who have a disability, 2015-2019 : | 5.9% |
| Persons under the age of 65 who do not have health insurance, as a percentage : | 10.1% |
| Total civilian labor force, percent of population aged 16 and up, 2015-2019 : | 64.2% |
| Female labor force participation in the civilian labor force, as a percentage of the population aged 16 and up, 2015-2019 : | 63.3% |
| Total sales of lodging and food services in 2012 ($1,000) : | 57,889 |
| Total receipts/revenue for health care and social assistance in 2012 ($1,000) : | 39,529 |
| Manufacturers' total shipments in 2012 ($1,000) : | 348,677 |
| 2012 total retail sales ($1,000) : | 430,225 |
| 2012 total retail sales per capita : | $15,107 |
| Mean commute time to work (in minutes), workers aged 16 and up, 2015-2019 : | 31.7 |
| 2015-2019 median household income (in 2019 dollars) : | $53,940 |
| Income per capita in the previous 12 months (in 2019 dollars), 2015-2019 : | $27,797 |
| Percentage of people living in poverty : | 15.5% |
| Total number of businesses in 2012 : | 2,521 |
| Men-owned businesses in 2012 : | 1,238 |
| Women-owned businesses in 2012 : | 1,056 |
| Minority-owned businesses in 2012 : | 1,176 |
| Non-minority-owned businesses in 2012 : | 1,261 |
| Veteran-owned businesses in 2012 : | 271 |
| Nonveteran-owned businesses in 2012 : | 2,172 |
| 2010 population per square mile : | 4,174.4 |
| 2010 land area in square miles : | 6.79 |
| Rate of owner-occupied housing units, 2015-2019 : | 57.7% |
| Owner-occupied housing unit median value, 2015-2019 : | $356,900 |
| From 2015 to 2019, the median selected monthly owner costs - with a mortgage : | $2,414 |
| Monthly owner costs, without a mortgage, at the median, 2015-2019 : | $988 |
| 2015-2019 median gross rent : | $1,279 |
| 2015-2019 Households : | 9,876 |
| Population per household, 2015-2019 : | 2.28 |
| Living in the same house a year ago, percentage of people aged one year and up, 2015-2019 : | 82.6% |
| Languages other than English spoken at home, as a percentage of people aged 5 and up, 2015-2019 : | 20.2% |
| Households with computers, %, 2015-2019 : | 93.7% |
| Percentage of households with a broadband Internet subscription, 2015-2019 : | 90.0% |
| Percentage of people aged 25 and up with a high school diploma or higher, 2015-2019 : | 97.7% |
| Bachelor's degree or higher, proportion of people aged 25 and up, 2015-2019 : | 61.8% |
| Percentage of people under the age of 65 who have a disability, 2015-2019 : | 4.1% |
| Persons under the age of 65 who do not have health insurance, as a percentage : | 5.5% |
| Total civilian labor force, percent of population aged 16 and up, 2015-2019 : | 70.2% |
| Female labor force participation in the civilian labor force, as a percentage of the population aged 16 and up, 2015-2019 : | 63.9% |
| Total sales of lodging and food services in 2012 ($1,000) : | 79,331 |
| Total receipts/revenue for health care and social assistance in 2012 ($1,000) : | 125,301 |
| Manufacturers' total shipments in 2012 ($1,000) : | 149,442 |
| 2012 total retail sales ($1,000) : | 371,315 |
| 2012 total retail sales per capita : | $16,396 |
| Mean commute time to work (in minutes), workers aged 16 and up, 2015-2019 : | 30.0 |
| 2015-2019 median household income (in 2019 dollars) : | $90,588 |
| Income per capita in the previous 12 months (in 2019 dollars), 2015-2019 : | $51,574 |
| Percentage of people living in poverty : | 5.5% |
| Total number of businesses in 2012 : | 3,118 |
| Men-owned businesses in 2012 : | 1,610 |
| Women-owned businesses in 2012 : | 1,021 |
| Minority-owned businesses in 2012 : | 635 |
| Non-minority-owned businesses in 2012 : | 2,267 |
| Veteran-owned businesses in 2012 : | 188 |
| Nonveteran-owned businesses in 2012 : | 2,735 |
| 2010 population per square mile : | 3,273.3 |
| 2010 land area in square miles : | 6.84 |
Best Things to Do in Frankfort
1Breidert Green Park
Frankfort, IL 60423, United States View details
2KidsWork Children's Museum
13 White St, Frankfort, IL 60423, United States View details
Phone: +18154691199 | Website available

3Commissioners Park
22108 S 80th Ave, Frankfort, IL 60423, United States View details
Phone: +18154699400 | Website available

4Crisis Rooms
20861 South La Grange Road, Frankfort, IL 60423, United States View details
Phone: +18155341256 | Website available
5Main Park
400 W Nebraska St, Frankfort, IL 60423, United States View details

Where to Eat in Frankfort
1Steak 'n Shake
20091 South La Grange Road, Frankfort, IL 60423, United States View details
Phone: +18158069564 | Website available

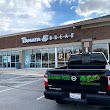
2Panera Bread
11069 W Lincoln Hwy, Frankfort, IL 60423, United States View details
Phone: +18158069500 | Website available
3Freddy's Frozen Custard & Steakburgers
9701 W Lincoln Hwy, Frankfort, IL 60423, United States View details
Phone: +17793245555 | Website available
4Buffalo Wild Wings
20596 South La Grange Road, Frankfort, IL 60423, United States View details
Phone: +18158062223 | Website available

5Culver's
20592 South La Grange Road, Frankfort, IL 60423, United States View details
Phone: +18154699986 | Website available

People born in Frankfort (56)
People born in Frankfort, including actor and singer Will Chase, lawyer and army officer Daniel Weisiger Adams, U.S. politician George Graham Vest, .
More notable people
- Humphrey Marshall (United States Congressman and general in the Confederate States Army (1812-1872)) he was born in 13/01/1812
- Thomas Carlin (American politician (1789-1852)) he was born in 18/07/1789
- Charles James Brenham (American mayor (1817-1876)) he was born in 06/11/1817
- Elizabeth ann hulett (profesionnal manager) she was born in 19/11/1960
- Evan E. Settle (American politician (1848-1899)) he was born in 01/12/1848
- Albert B. Fall (American politician (1861-1944)) he was born in 26/11/1861
- John Cummins Edwards (Historical US Democrat politician (1804-1888)) he was born in 24/06/1804
- John Glover South (American diplomat) he was born in 23/01/1873
- William Wirt Adams (Confederate States Army general (1819-1888)) he was born in 22/03/1819
- Thomas Francis Marshall (American politician) he was born in 07/06/1801
- Joseph Rodes Buchanan (American physician) he was born in 11/12/1814
- Albert Taylor Bledsoe (American priest, mathematician and army officer) he was born in 09/11/1809
- Archer Prewitt (musician) he was born in 01/01/1963
- Benjamin Milam (Texan revolutionary) he was born in 20/10/1788
- Bob Custer (American actor (1898-1974)) he was born in 18/10/1898
- Crit Luallen (American politician) she was born in 21/07/1952
- Dick Crutcher (Major League Baseball pitcher) he was born in 14/04/1914
- Eddie Bacon (American baseball player) he was born in 08/04/1895
Nearby Schools and Colleges
Schools and campuses linked to Frankfort, IL. Select a name to open its map and contact details.
| Code | Name | City | ZIP |
|---|---|---|---|
| 146205 | John A Logan College | Carterville (IL) | 62918-2500 |
| 148256 | Rend Lake College | Ina (IL) | 62846 |
| 149222 | Southern Illinois University-Carbondale | Carbondale (IL) | 62901-4512 |
| 148937 | Southeastern Illinois College | Harrisburg (IL) | 62946 |
Nearby Transit Stations (8)
Rail and bus stations connected to Frankfort, IL. Select a station to open its map and address details.
| Code | Name | Address | Type |
|---|---|---|---|
| MAI | Marion, IL | 2100 West Main Street | BUS |
| DQN | Du Quoin | 20 North Chestnut St. | RAIL |
| CDL | Carbondale station | 401 South Illinois St. | RAIL |
| MVI | Mt. Vernon, IL | 102 Potomac Boulevard | BUS |
| VNA | Vienna, IL | 504 West Vine Street | BUS |
Closest post offices linked to Frankfort.
| Post Office Name | City | ZIP |
|---|---|---|
| West Frankfor Post Office | West Frankfort (IL) | 62896 |
| Orien Post Office | Orient (IL) | 62874 |
| Logan Post Office | Logan (IL) | 62856 |
| Freeman Spur Post Office | Freeman Spur (IL) | 62841 |
| Johnston City Post Office | Johnston City (IL) | 62951 |
Other places with the same name (8)
- Frankfort, Kentucky county seat city in Franklin County, Kentucky, USA and Kentucky federated state capital city with a population of 27,715 people.
- Frankfort, Indiana county seat in Indiana with a population of 15,756 people.
- Frankfort, New York town in Herkimer County, New York with a population of 2,403 people.
- Frankfort, Michigan city in Benzie County, Michigan, United States of America with a population of 1,289 people.
- Frankfort, Maine town in Maine with a population of 1,196 people.
- Frankfort, Ohio city in Ross County, Ohio, United States of America with a population of 988 people.
- Frankfort, Kansas city in Kansas, United States with a population of 689 people.
- Frankfort, South Dakota city in South Dakota, United States with a population of 39 people.
Other cities in Franklin County
Cities, towns, neighborhoods & other populated places in Franklin County , IL.
| City Name | Population | Title |
|---|---|---|
| West Frankfort | 7,733 | City in Illinois, USA |
| Benton | 6,784 | City in Illinois |
| Logan | 3,057 | Unincorporated community in Illinois |
| Christopher | 2,686 | City in Franklin County, Illinois, United States |
| Sesser | 1,837 | City in Franklin County, Illinois, United States |
| Zeigler | 1,671 | City in Franklin County, Illinois, United States |
| Royalton | 1,110 | City in Minnesota |
| Valier | 630 | Human settlement in Illinois, United States of America |
| West City | 626 | Human settlement in Illinois, United States of America |
| Thompsonville | 519 | Village in Franklin County, Illinois, United States |
| Buckner | 435 | Human settlement in Illinois, United States of America |
| Orient | 338 | City in Franklin County, Illinois, United States |
| Ewing | 293 | City in Illinois, United States of America |
Distance to Other Cities
Frankfort distances to largest Illinois cities