Empire, Michigan
Empire: human settlement in Leelanau County, Michigan, United States of America
About
Empire is a city located in the county of Leelanau in the U.S. state of Michigan. Its population at the 2010 census was 375 and a population density of 117 people per km². After 10 years in 2020 city had an estimated population of 375 inhabitants.
The city was created 131 years ago in 1894.
Quick Facts about Empire
| Population | 375 (2020) |
| Country | United States of America |
| State | Michigan (United States) |
| County | Leelanau County |
| Postal code | 49630 |
| Area | 3.21 km2 |
| Latitude & Longitude | 44.8111,-86.0601 |
| Altitude | 610 feet / 186 meters |
| Establishment | January 01, 1895 (131 years ago) |
| Time Zone | America/Detroit |
| Local time | 20:49:29 (14th July 2026) |
| Density | 117 Pop. per km² as of 2020 |
| Population growth | 0% (2010-2020) |
Geography
Empire is located at 44°48'40"N 86°3'36"W (44.8111100, -86.0600900).
Empire map
Demographics
The population of Empire increased by 0% in 10 years.
| Year | Population | % Change | Method |
|---|---|---|---|
| 2010 | 375 | - | census |
| 2011 | 372 | -0.81% | estimation process |
| 2012 | 371 | -0.27% | estimation process |
| 2013 | 373 | 0.54% | estimation process |
| 2014 | 374 | 0.27% | estimation process |
| 2015 | 374 | 0% | estimation process |
| 2016 | 372 | -0.54% | estimation process |
| 2017 | 374 | 0.53% | estimation process |
| 2018 | 374 | 0% | estimation process |
| 2019 | 375 | 0.27% | estimation process |
| 2020 | 375 | 0% | estimation process |
Demographic Facts
| Estimated population as of July 1, 2019 : | 43,627 |
| Based on demographic estimates as of April 1, 2010 : | 42,686 |
| Based on demographic estimates as of 1 April 2010 : | 2.2% |
| April 1, 2020 Population : | 43,976 |
| April 1, 2010 Population : | 42,695 |
| People under 5 years old, percentage : | 4.8% |
| People under 18 years old, percentage : | 18.4% |
| People over 65 (%) : | 16.4% |
| Female persons, % : | 49.7% |
| White only, percent : | 88.1% |
| Black or African American alone, percent : | 3.5% |
| American Indian and Alaska Native only, % : | 0.6% |
| Asians alone % : | 4.7% |
| Only Native Hawaiians and Other Pacific Islanders, % : | 0.0% |
| % of people who have participated in two or more races : | 2.3% |
| % of Hispanic or Latino : | 3.0% |
| White people, not Hispanic or Latino people, make up the majority of the population. : | 86.1% |
| 2015-2019 Veterans : | 2,945 |
| Percentage of foreign-born people, 2015-2019 : | 9.5% |
| Rate of owner-occupied housing units, 2015-2019 : | 52.8% |
Economic Facts
| Rate of owner-occupied housing units, 2015-2019 : | 52.8% |
| Owner-occupied housing unit median value, 2015-2019 : | $230,200 |
| From 2015 to 2019, the median selected monthly owner costs - with a mortgage : | $1,893 |
| Monthly owner costs, without a mortgage, at the median, 2015-2019 : | $835 |
| 2015-2019 median gross rent : | $1,083 |
| 2015-2019 Households : | 17,530 |
| Population per household, 2015-2019 : | 2.29 |
| Living in the same house a year ago, percentage of people aged one year and up, 2015-2019 : | 85.4% |
| Languages other than English spoken at home, as a percentage of people aged 5 and up, 2015-2019 : | 10.5% |
| Households with computers, %, 2015-2019 : | 90.1% |
| Percentage of households with a broadband Internet subscription, 2015-2019 : | 84.1% |
| Percentage of people aged 25 and up with a high school diploma or higher, 2015-2019 : | 92.2% |
| Bachelor's degree or higher, proportion of people aged 25 and up, 2015-2019 : | 37.9% |
| Percentage of people under the age of 65 who have a disability, 2015-2019 : | 11.3% |
| Persons under the age of 65 who do not have health insurance, as a percentage : | 6.9% |
| Total civilian labor force, percent of population aged 16 and up, 2015-2019 : | 64.3% |
| Female labor force participation in the civilian labor force, as a percentage of the population aged 16 and up, 2015-2019 : | 62.8% |
| Total sales of lodging and food services in 2012 ($1,000) : | 122,868 |
| Total receipts/revenue for health care and social assistance in 2012 ($1,000) : | 997,862 |
| Manufacturers' total shipments in 2012 ($1,000) : | 330,854 |
| 2012 total retail sales ($1,000) : | 1,391,170 |
| 2012 total retail sales per capita : | $32,634 |
| Mean commute time to work (in minutes), workers aged 16 and up, 2015-2019 : | 22.8 |
| 2015-2019 median household income (in 2019 dollars) : | $66,719 |
| Income per capita in the previous 12 months (in 2019 dollars), 2015-2019 : | $35,768 |
| Percentage of people living in poverty : | 9.0% |
| Total number of businesses in 2012 : | 4,332 |
| Men-owned businesses in 2012 : | 2,375 |
| Women-owned businesses in 2012 : | 1,174 |
| Minority-owned businesses in 2012 : | 156 |
| Non-minority-owned businesses in 2012 : | 3,783 |
| Veteran-owned businesses in 2012 : | 425 |
| Nonveteran-owned businesses in 2012 : | 3,442 |
| 2010 population per square mile : | 664.6 |
| 2010 land area in square miles : | 64.24 |
Best Things to Do in Empire
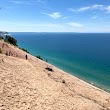
1Sleeping Bear Dunes Overlook
Empire, MI 49630, United States View details
Website available
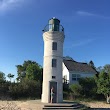
2Robert H. Manning Memorial Lighthouse
Lake Michigan Dr, Empire, MI 49630, United States View details
Phone: +18887847328
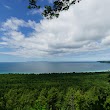
3Pierce Stocking Scenic Drive
Parking lot, Pierce Stocking Scenic Dr, Empire, MI 49630, United States View details
Website available

4Alligator Hill Trail
Stocking Rd, Empire, MI 49630, United States View details
Phone: +12313264700 | Website available
5South Manitou Island Lighthouse
Empire, MI 49630, United States View details
Phone: +13177093423 | Website available

Nearby Schools and Colleges
Schools and campuses linked to Empire, MI. Select a name to open its map and contact details.
| Code | Name | City | ZIP |
|---|---|---|---|
| 171483 | Northwestern Michigan College | Traverse City (MI) | 49686 |
Nearby Transit Stations (9)
Rail and bus stations connected to Empire, MI. Select a station to open its map and address details.
| Code | Name | Address | Type |
|---|---|---|---|
| TRV | Traverse City, Michigan | 107 Hall Street | BUS |
| KGS | Kingsley, Michigan | 119 E. Main St. | BUS |
| MTO | Manton, Michigan | Junction U.S. 131 & M-42 | BUS |
| CLC | Cadillac, Michigan | 1202 North Mitchell St. | BUS |
| CHL | Charlevoix, MI | 103 Bridge Park Drive | BUS |
Closest post offices linked to Empire.
| Post Office Name | City | ZIP |
|---|---|---|
| Empir Post Office | Empire (MI) | 49630 |
Other places with the same name (5)
- Empire, California place in Stanislaus County, USA with a population of 4,189 people.
- Empire, Illinois township in McLean County, Illinois with a population of 4,024 people.
- Empire, Minnesota township in Dakota County, Minnesota with a population of 3,071 people.
- Empire, Colorado Statutory Town in Clear Creek County, Colorado, United States with a population of 302 people.
- Empire, Ohio village in Jefferson County, Ohio, United States with a population of 279 people.
Other cities in Leelanau County
Cities, towns, neighborhoods & other populated places in Leelanau County , MI.
| City Name | Population | Title |
|---|---|---|
| Bingham | 2,960 | Township in Leelanau County, Michigan |
| Leland | 2,041 | Human settlement in Leelanau County, Michigan, United States of America |
| Greilickville | 1,530 | Unincorporated community in Michigan |
| Solon | 1,511 | Township in Leelanau County, Michigan |
| Glen Arbor | 858 | Township in Leelanau County, Michigan |
| Suttons Bay | 617 | Human settlement in Leelanau County, Michigan, United States of America |
| Northport | 525 | Human settlement in Leelanau County, Michigan, United States of America |
| Cedar | 456 | Township in Leelanau County, Michigan |