Basile, Louisiana
Basile: human settlement in Louisiana, United States of America
About
Basile is a city located in the county of Evangeline Parish in the U.S. state of Louisiana. Its population at the 2010 census was 1,821 and a population density of 1,570 people per km². After 10 years in 2020 city had an estimated population of 1,791 inhabitants.

Quick Facts about Basile
| Population | 1,791 (2020) |
| Country | United States of America |
| State | Louisiana (United States) |
| County | Evangeline Parish |
| Phone Area Codes | 337 |
| Area | 1.16 km2 |
| Latitude & Longitude | 30.4852,-92.5960 |
| Altitude | 46 feet / 14 meters |
| Time Zone | UTC−06:00 |
| Local time | 16:56:32 (14th July 2026) |
| Postal code | 70515 |
| Density | 1,544 Pop. per km² as of 2020 |
| Population growth | -1.68% (2010-2020) |
| Weather | 84℉ Showers And Thunderstorms 7-days weather |
Geography
Basile is located at 30°29'7"N 92°35'45"W (30.4852000, -92.5959700).
Basile map
Weather
A chance of rain showers before 7am, then showers and thunderstorms. Mostly cloudy, with a high near 84. West wind around 0 mph. Chance of precipitati...
7-Day ForecastDemographics
According to census records, the population of Basile decreased by 1.68% in 10 years.
| Year | Population | % Change | Method |
|---|---|---|---|
| 2010 | 1,821 | - | census |
| 2011 | 1,812 | -0.5% | estimation process |
| 2012 | 1,805 | -0.39% | estimation process |
| 2013 | 1,805 | 0% | estimation process |
| 2014 | 1,802 | -0.17% | estimation process |
| 2015 | 1,801 | -0.06% | estimation process |
| 2016 | 1,798 | -0.17% | estimation process |
| 2017 | 1,797 | -0.06% | estimation process |
| 2018 | 1,789 | -0.45% | estimation process |
| 2019 | 1,783 | -0.34% | estimation process |
| 2020 | 1,791 | 0.45% | estimation process |
Demographic Facts
| Estimated population as of July 1, 2019 : | 131,228 |
| Based on demographic estimates as of April 1, 2010 : | 131,086 |
| Based on demographic estimates as of 1 April 2010 : | 0.1% |
| April 1, 2020 Population : | 131,144 |
| April 1, 2010 Population : | 131,090 |
| People under 5 years old, percentage : | 6.3% |
| People under 18 years old, percentage : | 21.7% |
| People over 65 (%) : | 16.9% |
| Female persons, % : | 50.8% |
| White only, percent : | 84.5% |
| Black or African American alone, percent : | 9.7% |
| American Indian and Alaska Native only, % : | 0.4% |
| Asians alone % : | 2.5% |
| Only Native Hawaiians and Other Pacific Islanders, % : | 0.4% |
| % of people who have participated in two or more races : | 2.5% |
| % of Hispanic or Latino : | 4.6% |
| White people, not Hispanic or Latino people, make up the majority of the population. : | 80.6% |
| 2015-2019 Veterans : | 7,589 |
| Percentage of foreign-born people, 2015-2019 : | 6.4% |
| Residential units, July 1, 2019 : | 58,457 |
Economic Facts
| Residential units, July 1, 2019 : | 58,457 |
| Rate of owner-occupied housing units, 2015-2019 : | 65.5% |
| Owner-occupied housing unit median value, 2015-2019 : | $147,500 |
| From 2015 to 2019, the median selected monthly owner costs - with a mortgage : | $1,178 |
| Monthly owner costs, without a mortgage, at the median, 2015-2019 : | $463 |
| 2015-2019 median gross rent : | $801 |
| Permits for construction, 2020 : | 268 |
| 2015-2019 Households : | 52,905 |
| Population per household, 2015-2019 : | 2.41 |
| Living in the same house a year ago, percentage of people aged one year and up, 2015-2019 : | 80.0% |
| Languages other than English spoken at home, as a percentage of people aged 5 and up, 2015-2019 : | 9.2% |
| Households with computers, %, 2015-2019 : | 89.2% |
| Percentage of households with a broadband Internet subscription, 2015-2019 : | 81.4% |
| Percentage of people aged 25 and up with a high school diploma or higher, 2015-2019 : | 91.4% |
| Bachelor's degree or higher, proportion of people aged 25 and up, 2015-2019 : | 29.1% |
| Percentage of people under the age of 65 who have a disability, 2015-2019 : | 8.3% |
| Persons under the age of 65 who do not have health insurance, as a percentage : | 5.7% |
| Total civilian labor force, percent of population aged 16 and up, 2015-2019 : | 67.8% |
| Female labor force participation in the civilian labor force, as a percentage of the population aged 16 and up, 2015-2019 : | 64.1% |
| Total sales of lodging and food services in 2012 ($1,000) : | 318,363 |
| Total receipts/revenue for health care and social assistance in 2012 ($1,000) : | 990,218 |
| Manufacturers' total shipments in 2012 ($1,000) : | 9,665,489 |
| 2012 total retail sales ($1,000) : | 2,110,454 |
| 2012 total retail sales per capita : | $16,010 |
| Mean commute time to work (in minutes), workers aged 16 and up, 2015-2019 : | 16.2 |
| 2015-2019 median household income (in 2019 dollars) : | $53,539 |
| Income per capita in the previous 12 months (in 2019 dollars), 2015-2019 : | $30,563 |
| Percentage of people living in poverty : | 13.7% |
| Total number of employer establishments, 2019 : | 3,174 |
| 2019 total employment : | 63,661 |
| 2019 total annual payroll ($1,000) : | 2,853,280 |
| Total employment, change in percentage terms, 2018-2019 : | 0.6% |
| 2018 total non-employer establishments : | 7,420 |
| Total number of businesses in 2012 : | 9,054 |
| Men-owned businesses in 2012 : | 4,623 |
| Women-owned businesses in 2012 : | 3,060 |
| Minority-owned businesses in 2012 : | 699 |
| Non-minority-owned businesses in 2012 : | 7,916 |
| Veteran-owned businesses in 2012 : | 960 |
| Nonveteran-owned businesses in 2012 : | 7,397 |
| 2010 population per square mile : | 231.7 |
| 2010 land area in square miles : | 565.77 |
| Rate of owner-occupied housing units, 2015-2019 : | 65.0% |
| Owner-occupied housing unit median value, 2015-2019 : | $159,000 |
| From 2015 to 2019, the median selected monthly owner costs - with a mortgage : | $1,597 |
| Monthly owner costs, without a mortgage, at the median, 2015-2019 : | $721 |
| 2015-2019 median gross rent : | $998 |
| 2015-2019 Households : | 10,949 |
| Population per household, 2015-2019 : | 2.51 |
| Living in the same house a year ago, percentage of people aged one year and up, 2015-2019 : | 88.5% |
| Languages other than English spoken at home, as a percentage of people aged 5 and up, 2015-2019 : | 13.3% |
| Households with computers, %, 2015-2019 : | 87.1% |
| Percentage of households with a broadband Internet subscription, 2015-2019 : | 81.1% |
| Percentage of people aged 25 and up with a high school diploma or higher, 2015-2019 : | 84.2% |
| Bachelor's degree or higher, proportion of people aged 25 and up, 2015-2019 : | 17.8% |
| Percentage of people under the age of 65 who have a disability, 2015-2019 : | 11.0% |
| Persons under the age of 65 who do not have health insurance, as a percentage : | 4.8% |
| Total civilian labor force, percent of population aged 16 and up, 2015-2019 : | 61.9% |
| Female labor force participation in the civilian labor force, as a percentage of the population aged 16 and up, 2015-2019 : | 58.6% |
| Total sales of lodging and food services in 2012 ($1,000) : | 42,518 |
| Total receipts/revenue for health care and social assistance in 2012 ($1,000) : | 106,037 |
| Manufacturers' total shipments in 2012 ($1,000) : | 450,446 |
| 2012 total retail sales ($1,000) : | 460,494 |
| 2012 total retail sales per capita : | $16,090 |
| Mean commute time to work (in minutes), workers aged 16 and up, 2015-2019 : | 23.4 |
| 2015-2019 median household income (in 2019 dollars) : | $58,138 |
| Income per capita in the previous 12 months (in 2019 dollars), 2015-2019 : | $30,848 |
| Percentage of people living in poverty : | 16.5% |
| Total number of businesses in 2012 : | 1,666 |
| Men-owned businesses in 2012 : | 1,010 |
| Women-owned businesses in 2012 : | 456 |
| Minority-owned businesses in 2012 : | 374 |
| Non-minority-owned businesses in 2012 : | 1,190 |
| Veteran-owned businesses in 2012 : | 203 |
| Nonveteran-owned businesses in 2012 : | 1,357 |
| 2010 population per square mile : | 676.2 |
| 2010 land area in square miles : | 42.00 |
Services and Civic Places in Basile
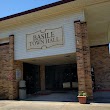
1Basile Town Hall
3200-3210 E Railroad St, Basile, LA 70515 View details
Phone: +13374326693
Nearby Schools and Colleges
Schools and campuses linked to Basile, LA. Select a name to open its map and contact details.
| Code | Name | City | ZIP |
|---|---|---|---|
| 159407 | Louisiana State University-Eunice | Eunice (LA) | 70535 |
Nearby Transit Stations (3)
Rail and bus stations connected to Basile, LA. Select a station to open its map and address details.
| Code | Name | Address | Type |
|---|---|---|---|
| LFT | Lafayette | 133 East Grant St. | RAIL |
| LCH | Lake Charles | 100 Ryan Street | RAIL |
| NIB | New Iberia | West Washington St. | RAIL |
Closest post offices linked to Basile.
| Post Office Name | City | ZIP |
|---|---|---|
| Basil Post Office | Basile (LA) | 70515 |
Other cities in Evangeline Parish
Cities, towns, neighborhoods & other populated places in Evangeline Parish , LA.
| City Name | Population | Title |
|---|---|---|
| Ville Platte | 7,047 | Town in Evangeline Parish, Louisiana, United States |
| Mamou | 3,077 | Human settlement in Louisiana, United States of America |
| Pine Prairie | 1,444 | City in Louisiana, United States of America |
| Turkey Creek | 464 | Human settlement in Louisiana, United States of America |
| Chataignier | 355 | Human settlement in Louisiana, United States of America |
Distance to Other Cities
Basile distances to largest Louisiana cities