Antigua and Barbuda, AG
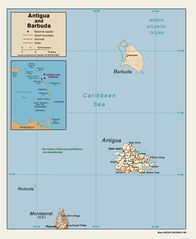
Antigua and Barbuda: This twin-island nation in the Caribbean Sea, southeast of Puerto Rico, is known for its reef-lined coasts, rainforests, and vibrant culture.
About

Country Snapshot
Antigua and Barbuda at a glance
Antigua and Barbuda currently has 4 quality-checked populated place pages and 8 state or regional pages linked on MapSof.
Mapped cities & towns
4
These counts use a stricter populated-place filter so the main lists stay focused on real city and town pages.
States & regions
8
Open related pagesLargest city
Saint John’sPopulation 24,226
Top linked places
Quick Facts about Antigua and Barbuda
| Population | 103,603 |
| Country | Antigua and Barbuda |
| Area | 440.29 km2 |
| Official name | Antigua-et-Barbuda, Antigua and Barbuda |
| Continent | North America |
| Easternmost point | Point(-61.65713 17.06917) |
| Northernmost point | Point(-61.85 17.73) |
| Latitude & Longitude | 17.0500,-61.8000 |
| Legislative body | Parliament of Antigua and Barbuda |
| Official language | English |
| Capital | St. John's |
| Establishment | November 01, 1981 (44 years ago) |
| Time Zone | UTC−04:00 |
| Local time | 00:18:39 (20th July 2026) |
Geography
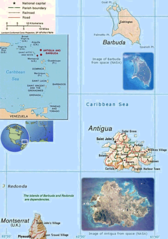
Antigua and Barbuda is located at 17°3'0"N 61°48'0"W (17.0500000, -61.8000000).
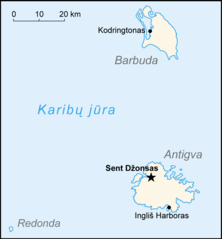
Antigua and Barbuda map
The largest city of Antigua and Barbuda is Saint John’s with a population of 24,226. . See all Antigua and Barbuda cities & populated places.
Official website of Antigua and Barbuda
Official Website- Redonda
- Saint Philip Parish
- Saint George Parish
- Barbuda
- Saint John Parish
- Saint Paul Parish
- Saint Mary Parish
- Saint Peter Parish
Demographics
| Year | Population | % Change | Method |
|---|---|---|---|
| 1960 | 54,681 | - | demographic balance |
| 1961 | 55,403 | 1.3% | demographic balance |
| 1962 | 56,311 | 1.61% | demographic balance |
| 1963 | 57,368 | 1.84% | demographic balance |
| 1964 | 58,500 | 1.94% | demographic balance |
| 1965 | 59,653 | 1.93% | demographic balance |
| 1966 | 60,818 | 1.92% | demographic balance |
| 1967 | 62,002 | 1.91% | demographic balance |
| 1968 | 63,176 | 1.86% | demographic balance |
| 1969 | 64,307 | 1.76% | demographic balance |
| 1970 | 65,369 | 1.62% | demographic balance |
| 1971 | 66,338 | 1.46% | demographic balance |
| 1972 | 67,205 | 1.29% | demographic balance |
| 1973 | 67,972 | 1.13% | demographic balance |
| 1974 | 68,655 | 0.99% | demographic balance |
| 1975 | 69,253 | 0.86% | demographic balance |
| 1976 | 69,782 | 0.76% | demographic balance |
| 1977 | 70,223 | 0.63% | demographic balance |
| 1978 | 70,508 | 0.4% | demographic balance |
| 1979 | 70,553 | 0.06% | demographic balance |
| 1980 | 70,301 | -0.36% | demographic balance |
| 1981 | 69,750 | -0.79% | demographic balance |
| 1982 | 68,950 | -1.16% | demographic balance |
| 1983 | 67,958 | -1.46% | demographic balance |
| 1984 | 66,863 | -1.64% | demographic balance |
| 1985 | 65,744 | -1.7% | demographic balance |
| 1986 | 64,605 | -1.76% | demographic balance |
| 1987 | 63,484 | -1.77% | demographic balance |
| 1988 | 62,538 | -1.51% | demographic balance |
| 1989 | 61,967 | -0.92% | demographic balance |
| 1990 | 61,906 | -0.1% | demographic balance |
| 1991 | 62,412 | 0.81% | demographic balance |
| 1992 | 63,434 | 1.61% | demographic balance |
| 1993 | 64,868 | 2.21% | demographic balance |
| 1994 | 66,550 | 2.53% | demographic balance |
| 1995 | 68,349 | 2.63% | demographic balance |
| 1996 | 70,245 | 2.7% | demographic balance |
| 1997 | 72,232 | 2.75% | demographic balance |
| 1998 | 74,206 | 2.66% | demographic balance |
| 1999 | 76,041 | 2.41% | demographic balance |
| 2000 | 77,648 | 2.07% | demographic balance |
| 2001 | 78,972 | 1.68% | demographic balance |
| 2002 | 80,030 | 1.32% | demographic balance |
| 2003 | 80,904 | 1.08% | demographic balance |
| 2004 | 81,718 | 1% | demographic balance |
| 2005 | 82,565 | 1.03% | demographic balance |
| 2006 | 83,467 | 1.08% | demographic balance |
| 2007 | 84,397 | 1.1% | demographic balance |
| 2008 | 85,349 | 1.12% | demographic balance |
| 2009 | 86,300 | 1.1% | demographic balance |
| 2010 | 87,233 | 1.07% | demographic balance |
| 2011 | 88,152 | 1.04% | demographic balance |
| 2012 | 89,069 | 1.03% | demographic balance |
| 2013 | 89,985 | 1.02% | demographic balance |
| 2014 | 92,562 | 2.78% | |
| 2015 | 93,566 | 1.07% | |
| 2016 | 100,963 | 7.33% | demographic balance |
| 2017 | 102,012 | 1.03% | demographic balance |
| 2018 | 96,286 | -5.95% | |
| 2019 | 97,118 | 0.86% | |
| 2026 | 103,603 | 6.26% |
Map & Images (more maps)
Ac Map (lt)
Ac Map Cs
Ac Map
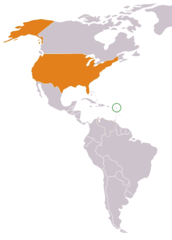
Antigua And Barbuda Usa Locator
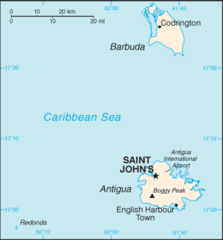
Antigua And Barbuda Cia Wfb Map
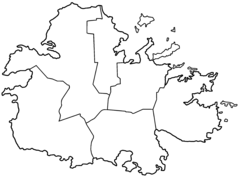
Antigua Parishes Blank
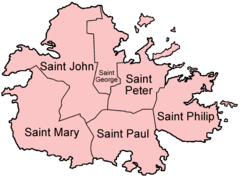
Antigua Parishes English
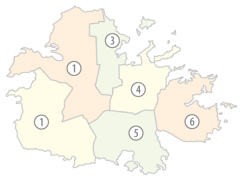
Antigua Parishes Numbered (color)
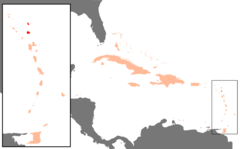
Karibik Antigua Und Barbuda Position
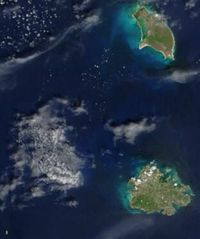
Satellite Image of Antigua And Barbuda In September 2002
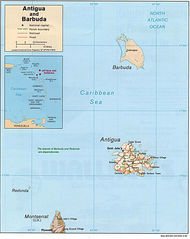
Antigua And Barbuda Map
Antigua Barbuda