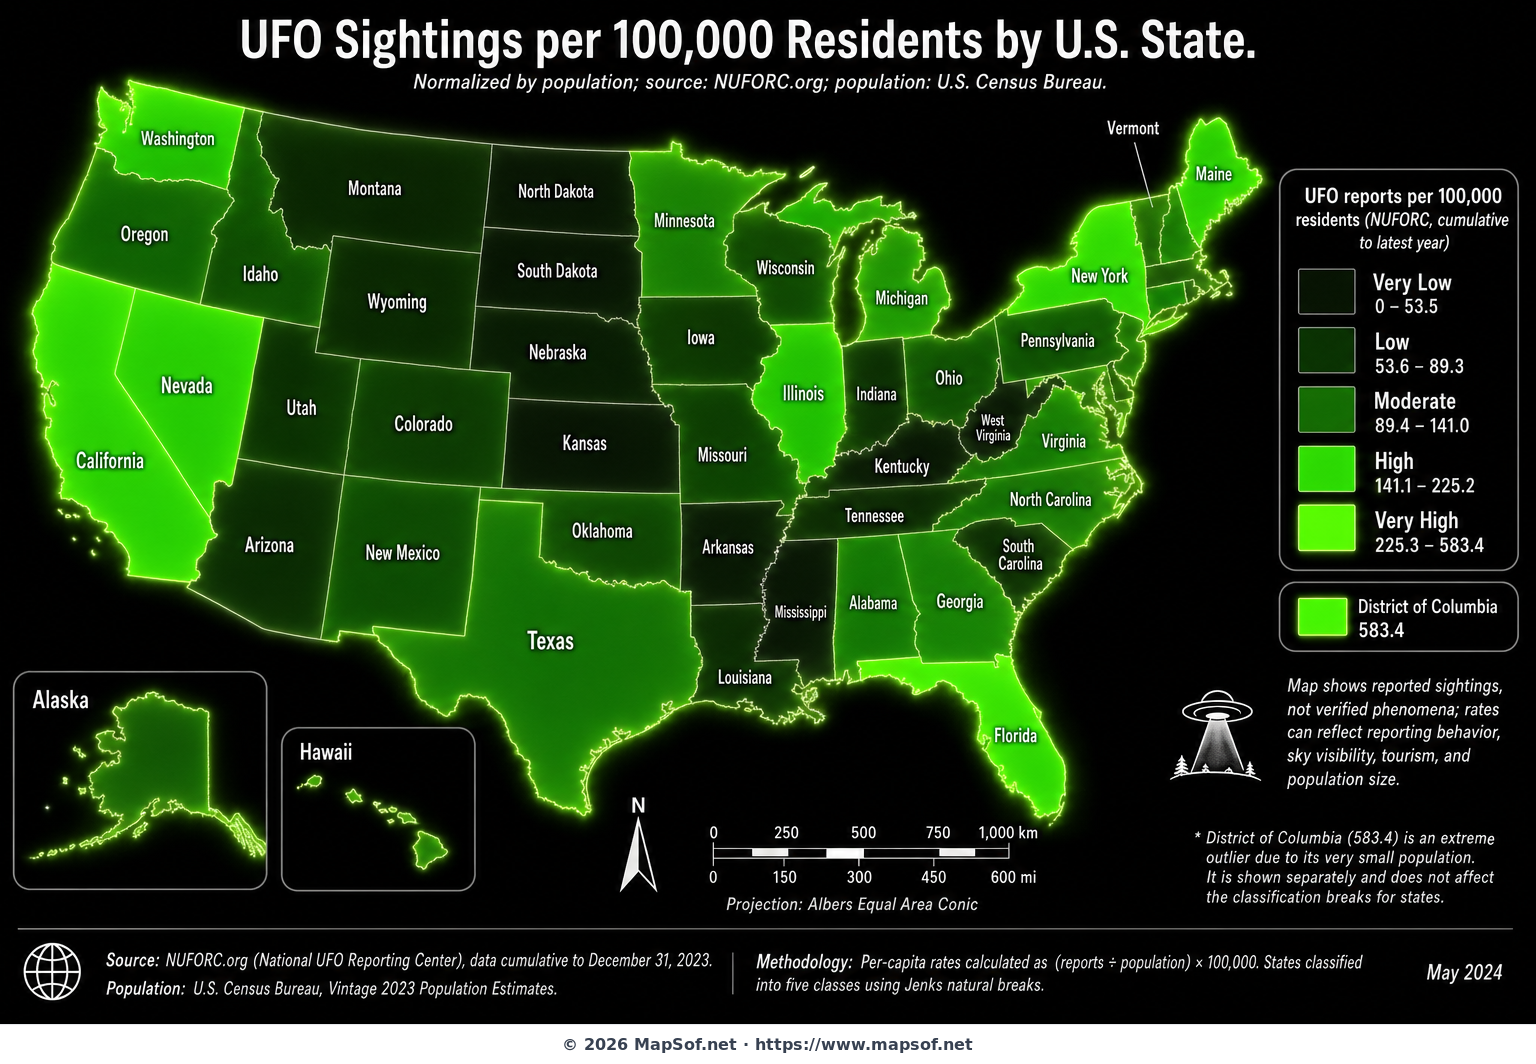
UFO Sightings per 100,000 Residents by U.S. State (NUFORC)
This state-by-state visualization compares UFO sighting intensity across the United States by normalizing National UFO Reporting Center (NUFORC) reports to population. By mapping reports per 100,000 residents instead of raw counts, the design highlights where sightings are unusually frequent relative to how many people live there. A neon-green glow over a deep black background lends a nocturnal, mysterious tone that fits the subject while keeping the data legible.
How to Read This Map
Each state’s luminance reflects its per-capita report rate, grouped into five classes from Very Low to Very High. Alaska and Hawaii are included as insets, and the District of Columbia may appear as a small callout because of its size. Reported hotspots often occur in regions with vast skies and strong skywatching cultures—western and northern states frequently stand out—while more urbanized or densely populated areas can appear comparatively dim once population is accounted for. Keep in mind this map represents reported sightings, not confirmed events. Differences may reflect reporting habits, visibility, tourism, and media attention as much as anything in the sky.
More United States Static Maps
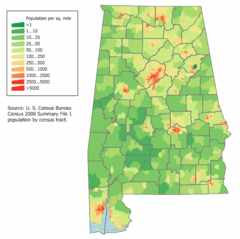
Alabama Population Map
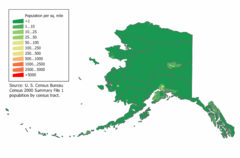
Alaska Population Map
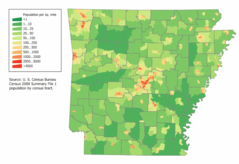
Arkansas Population Map
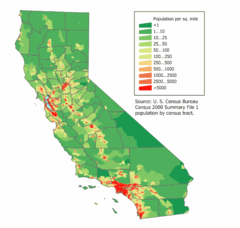
California Population Map
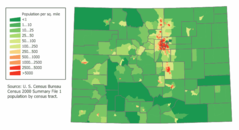
Colorado Population Map
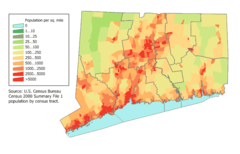
Connecticut Population Map
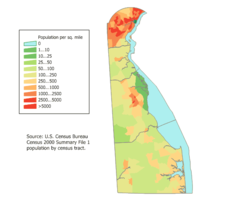
Delaware Population Map
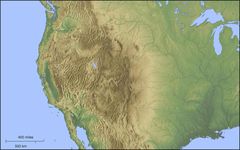
Der Westen Der Vereinigten Staaten
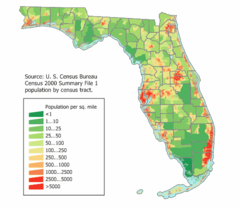
Florida Population Map
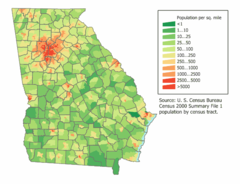
Georgia Population Map
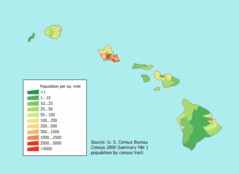
Hawaii Population Map
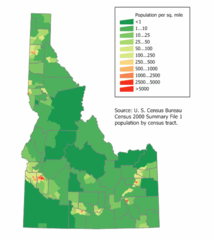
Idaho Population Map
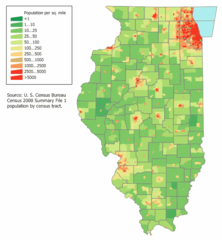
Illinois Population Map
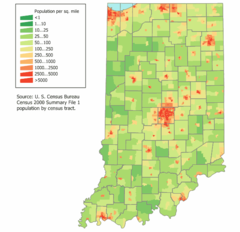
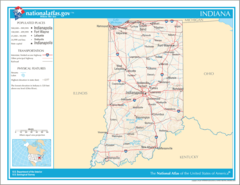
Indiana Population Map
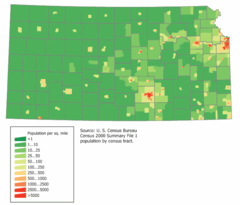
Kansas Population Map
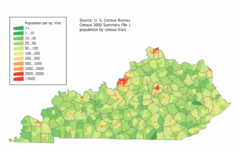
Kentucky Population Map
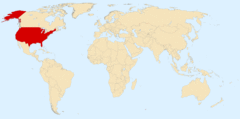
Location Uf Us
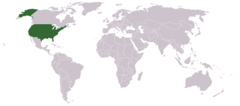
Location Usa
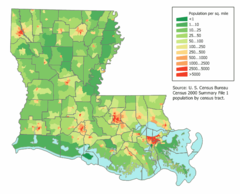
Louisiana Population Map
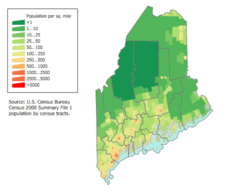
Maine Population Map
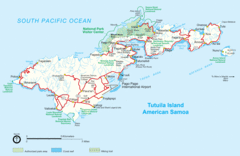
Mapoftutuila American Samoa
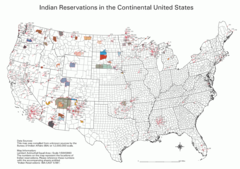
Map Indian Reservations Usa
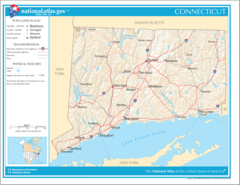
Map of Connecticut Na
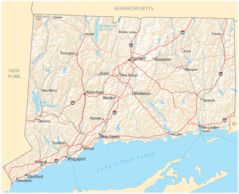
Map of Connecticut Na Cropp
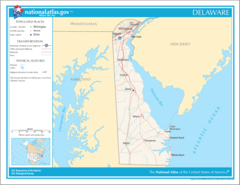
Map of Delaware Na
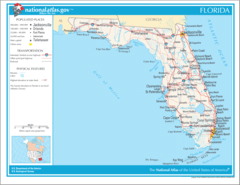
Map of Florida Na
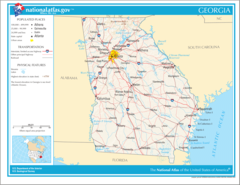
Map of Georgia Na
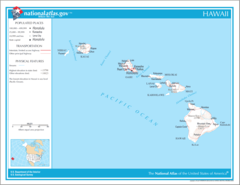
Map of Hawaii Na
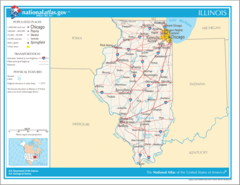
Map of Illinois Na