The Coffee Line: Starbucks vs Dunkin' Dominance by U.S. State
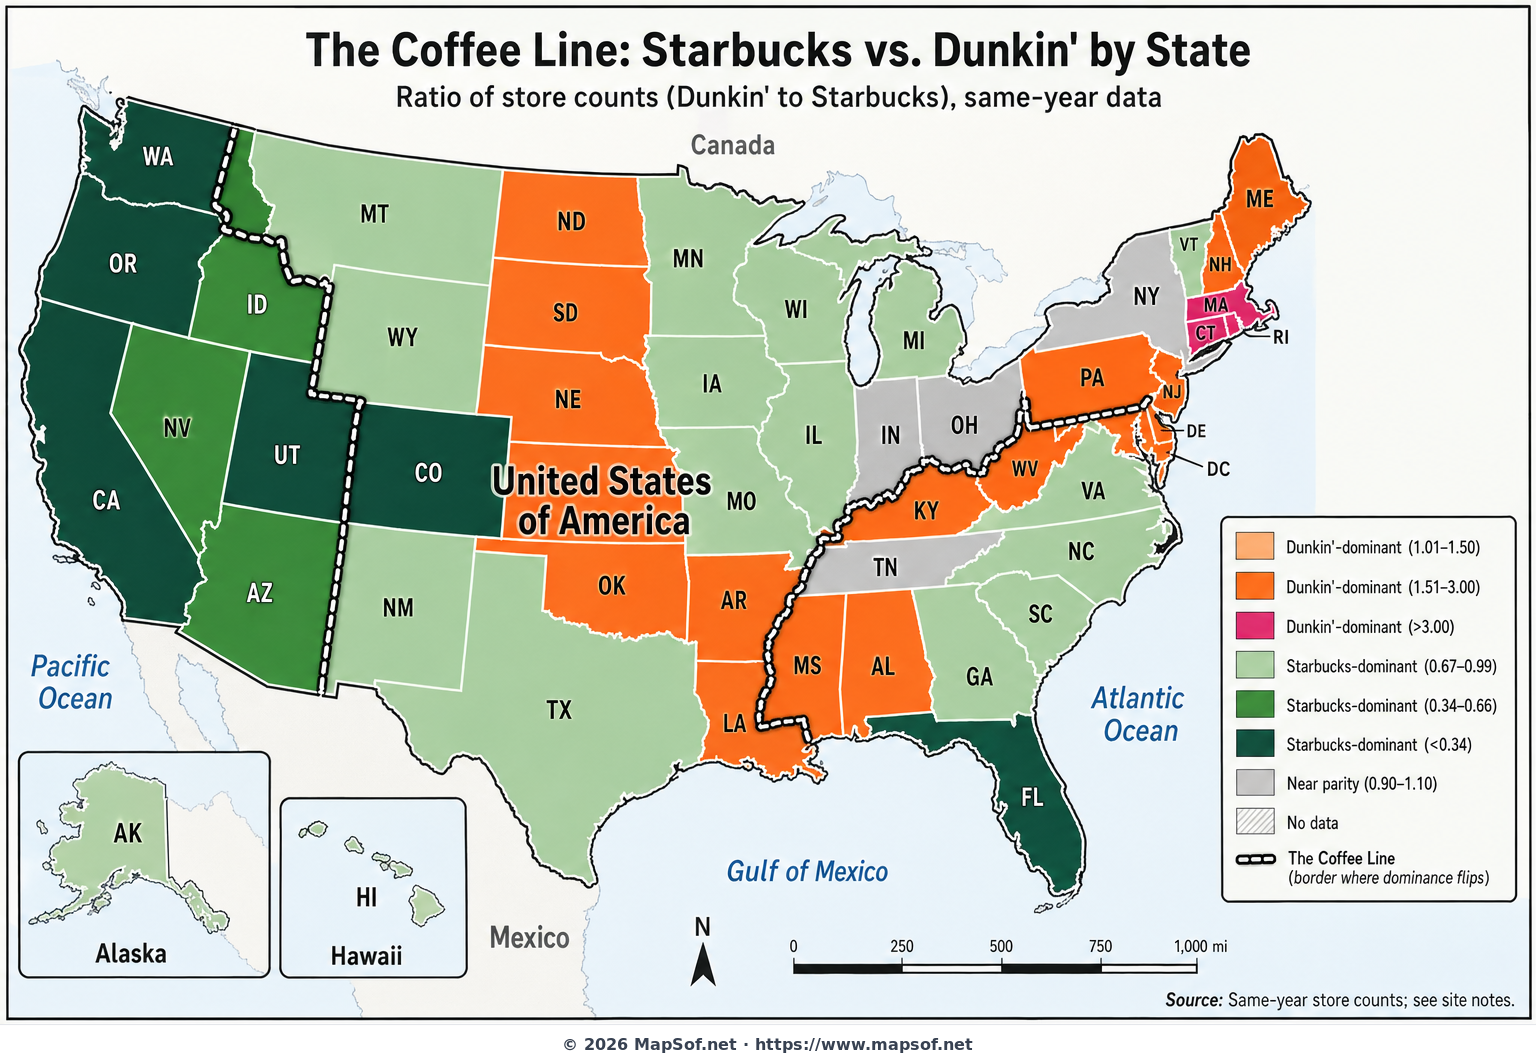
The Coffee Line: Where Starbucks Meets Dunkin' Across America
This map visualizes the state-by-state balance of America’s two most recognizable coffee brands using a simple metric: the ratio of Dunkin' to Starbucks locations in each state. By shading states in vibrant Dunkin' orange/pink or deep Starbucks greens, it reveals where each brand holds the upper hand, and it draws a bold "Coffee Line" along the borders where dominance flips. A neutral gray highlights near-parity states, acknowledging the many places where loyalties are genuinely mixed.
While Starbucks maintains a sweeping national footprint—especially strong in the West and major metros—Dunkin' remains a cultural mainstay in the Northeast and Mid-Atlantic. The classification reflects intensity as well: subtle shades mark slim advantages, while the boldest hues indicate overwhelming dominance. Designed with a clean, modern aesthetic and a clear legend, the map is easy to read at a glance yet rich enough to spark debate about regional coffee culture, convenience, and brand identity. Note: figures should come from the same-year counts to ensure fair comparisons as store openings and closures change over time.
Why it matters: Coffee choices are habits, commutes, and communities. This map turns those routines into a compelling picture of regional identity—perfect for fueling the ongoing conversation about America’s East vs. West coffee culture.
More United States Static Maps
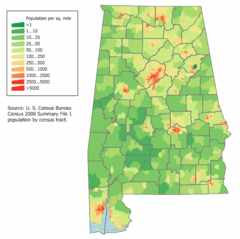
Alabama Population Map
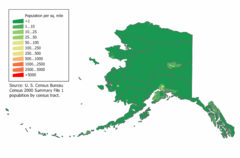
Alaska Population Map
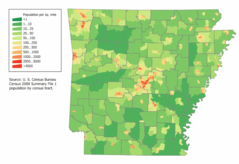
Arkansas Population Map
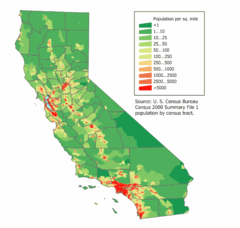
California Population Map
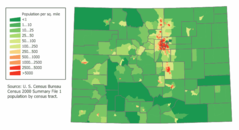
Colorado Population Map
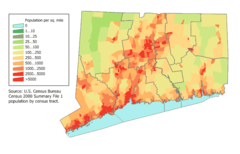
Connecticut Population Map
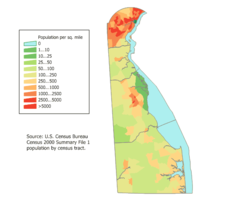
Delaware Population Map
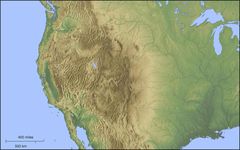
Der Westen Der Vereinigten Staaten
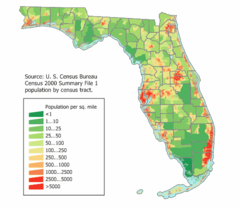
Florida Population Map
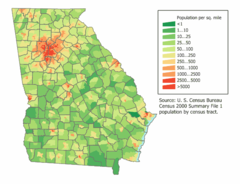
Georgia Population Map
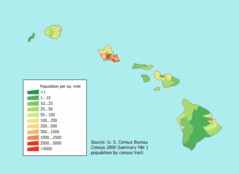
Hawaii Population Map
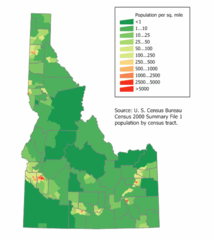
Idaho Population Map
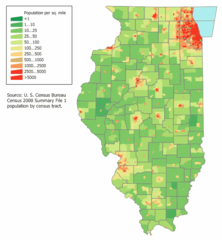
Illinois Population Map
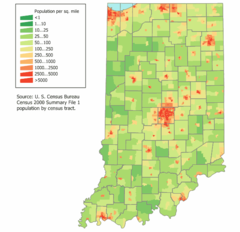
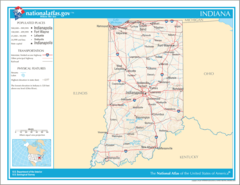
Indiana Population Map
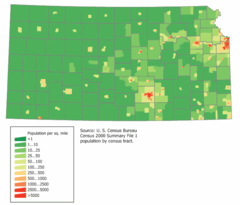
Kansas Population Map
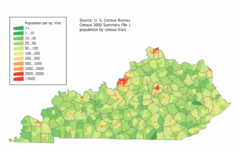
Kentucky Population Map
Location Uf Us
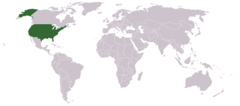
Location Usa
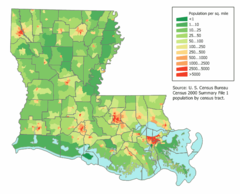
Louisiana Population Map
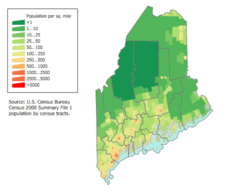
Maine Population Map
Mapoftutuila American Samoa
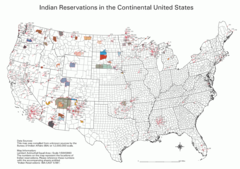
Map Indian Reservations Usa
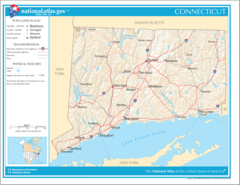
Map of Connecticut Na
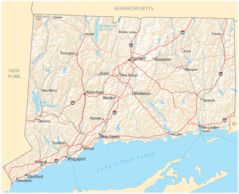
Map of Connecticut Na Cropp
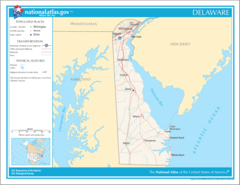
Map of Delaware Na
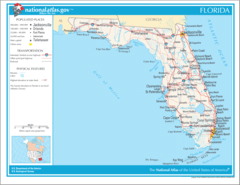
Map of Florida Na
Map of Georgia Na
Map of Hawaii Na
Map of Illinois Na