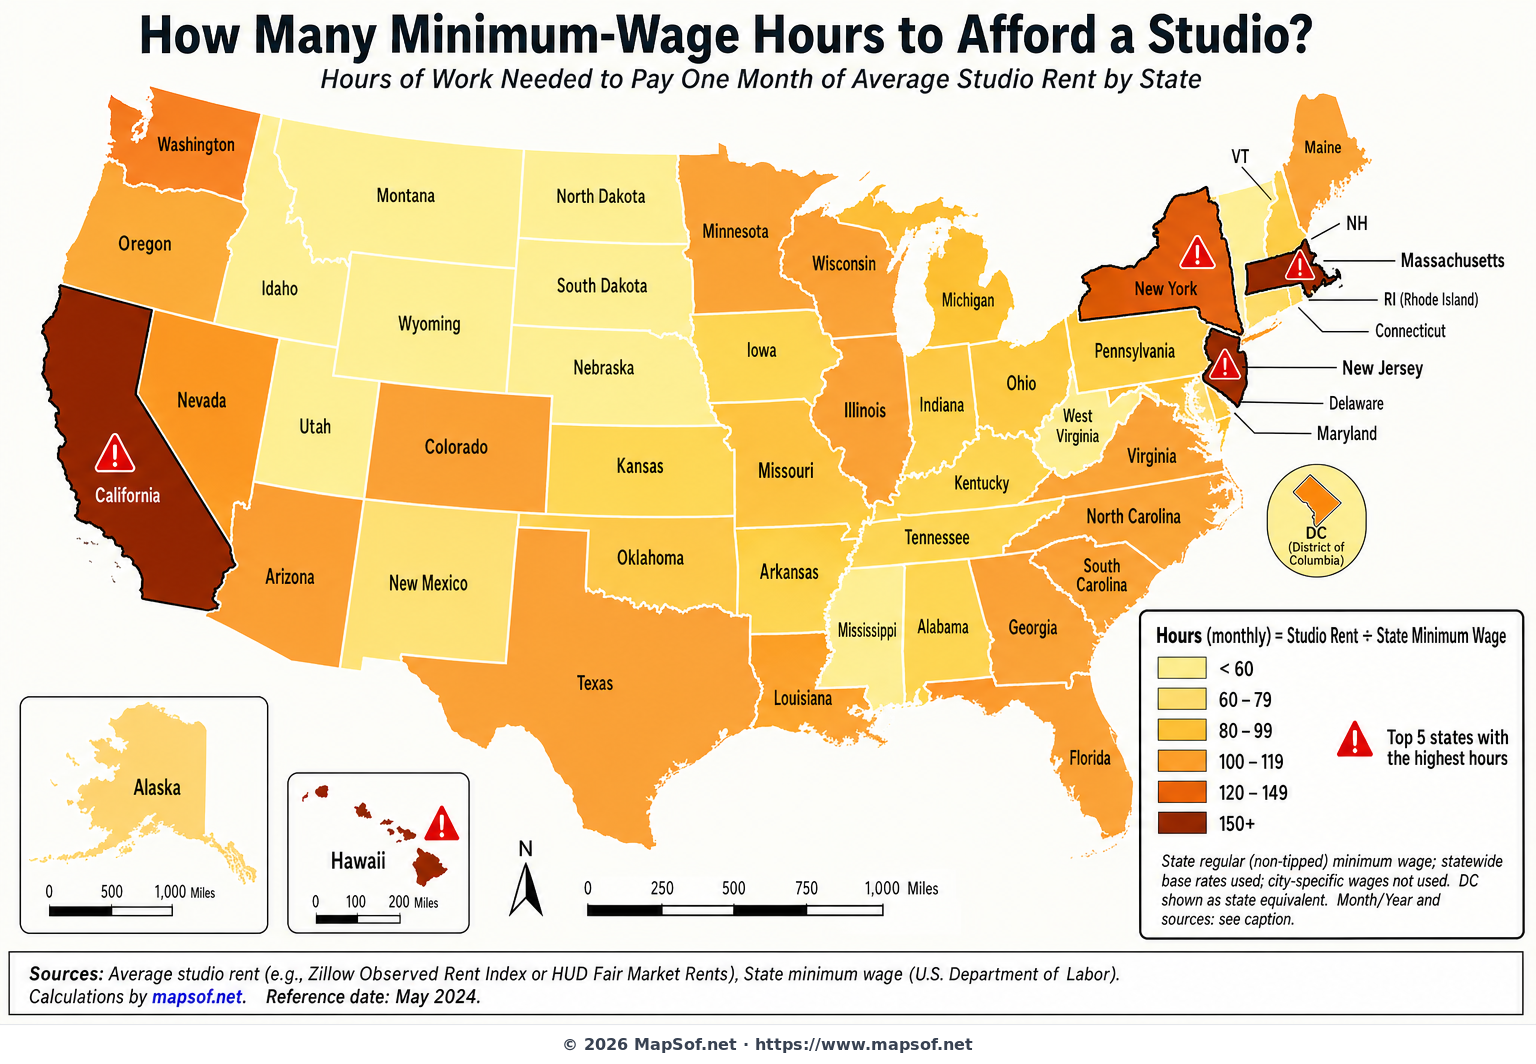
How Many Minimum‑Wage Hours to Afford a Studio? U.S. State Map
This choropleth map visualizes how many hours of minimum-wage work are needed to pay one month of rent for an average studio apartment in each U.S. state and the District of Columbia. By translating rents into labor time, the map offers an intuitive way to compare housing affordability across regions, from coastal metros to the nation’s interior. A sequential color ramp darkens as the required hours increase, while the five most time-intensive states are flagged with a caution symbol to underscore acute affordability pressure.
Methodology: For each state, the number of hours equals the average monthly studio rent divided by the state’s regular (non‑tipped) minimum wage, using a consistent reference month and year. City-specific wage ordinances are not used; statewide base rates are applied for comparability. The result highlights stark disparities: places with high rents and modest wage floors push the required hours sharply upward, while states with higher minimum wages or lower rents require fewer hours.
Why This Matters
Converting rent into hours worked reveals the everyday tradeoffs low-wage workers face. The map makes it easy to spot patterns—coastal and tourism-heavy states often cluster at the high end—while large swaths of the interior appear relatively lighter. Policymakers, advocates, and researchers can use this view to frame discussions on wage policy, housing supply, and cost-of-living relief, grounded in a metric that directly connects paychecks to shelter.
More United States Static Maps
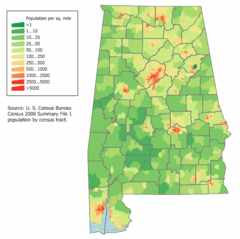
Alabama Population Map
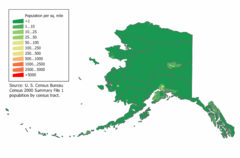
Alaska Population Map
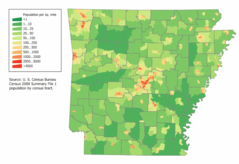
Arkansas Population Map
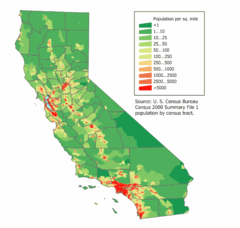
California Population Map
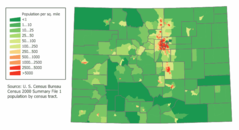
Colorado Population Map
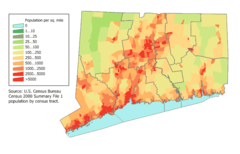
Connecticut Population Map
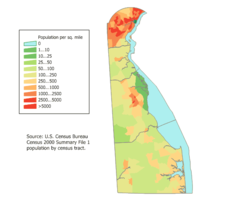
Delaware Population Map
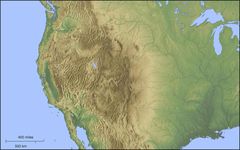
Der Westen Der Vereinigten Staaten
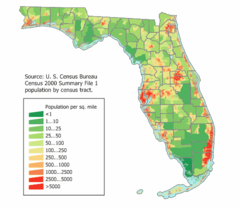
Florida Population Map
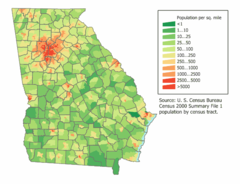
Georgia Population Map
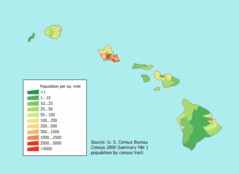
Hawaii Population Map
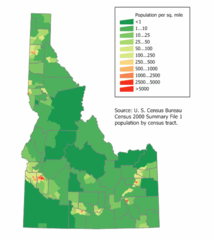
Idaho Population Map
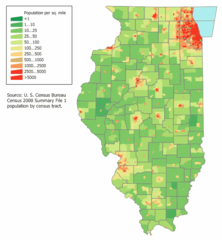
Illinois Population Map
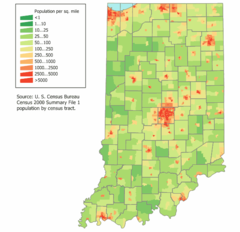
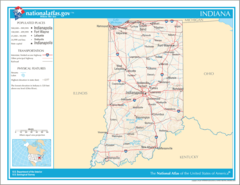
Indiana Population Map
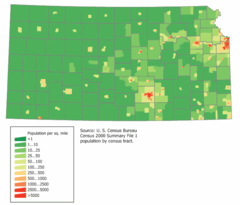
Kansas Population Map
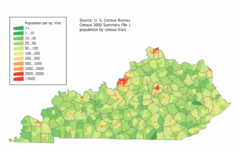
Kentucky Population Map
Location Uf Us

Location Usa
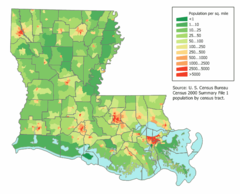
Louisiana Population Map
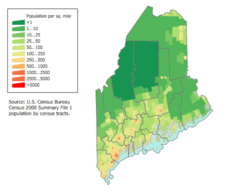
Maine Population Map
Mapoftutuila American Samoa
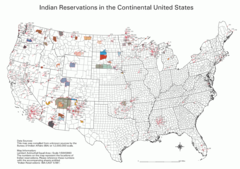
Map Indian Reservations Usa
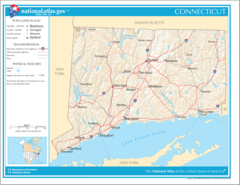
Map of Connecticut Na
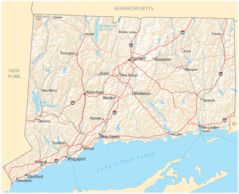
Map of Connecticut Na Cropp
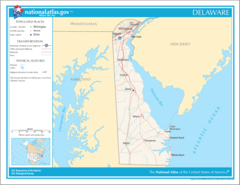
Map of Delaware Na
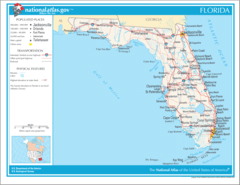
Map of Florida Na
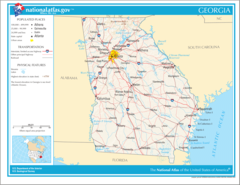
Map of Georgia Na
Map of Hawaii Na
Map of Illinois Na