Spring City, Pennsylvania
Spring City: city in Sanpete County, Utah, United States
About
Spring City is a city located in the county of Chester in the U.S. state of Pennsylvania. Its population at the 2010 census was 3,323 and a population density of 909 people per km². After 10 years in 2020 city had an estimated population of 3,285 inhabitants.
The city was created 174 years ago in 1851.

Quick Facts about Spring City
| Population | 3,285 (2020) |
| Country | United States of America |
| State | Pennsylvania (United States) |
| County | Chester County |
| Postal code | 84662 |
| Phone Area Codes | 435 |
| Area | 3.66 km2 |
| Latitude & Longitude | 40.1768,-75.5477 |
| Named for | spring |
| Altitude | 5,823 feet / 1775 meters |
| Establishment | January 01, 1852 (174 years ago) |
| Time Zone | Mountain Time Zone |
| Local time | 13:41:47 (19th June 2026) |
| Density | 899 Pop. per km² as of 2020 |
| Population growth | -1.16% (2010-2020) |
| Weather | 80℉ Mostly Sunny 7-days weather |

Geography
Spring City is located at 40°10'36"N 75°32'52"W (40.1767700, -75.5476900).
Spring City map
Weather
Mostly sunny, with a high near 80. Northwest wind 10 to 15 mph, with gusts as high as 25 mph.
7-Day ForecastOfficial website of Spring City
Official WebsiteDemographics
According to census records, the population of Spring City decreased by 1.16% in 10 years.
| Year | Population | % Change | Method |
|---|---|---|---|
| 2010 | 3,323 | - | census |
| 2011 | 3,332 | 0.27% | estimation process |
| 2012 | 3,335 | 0.09% | estimation process |
| 2013 | 3,337 | 0.06% | estimation process |
| 2014 | 3,339 | 0.06% | estimation process |
| 2015 | 3,331 | -0.24% | estimation process |
| 2016 | 3,320 | -0.33% | estimation process |
| 2017 | 3,314 | -0.18% | estimation process |
| 2018 | 3,316 | 0.06% | estimation process |
| 2019 | 3,303 | -0.39% | estimation process |
| 2020 | 3,285 | -0.55% | estimation process |
Demographic Facts
| Estimated population as of July 1, 2019 : | 14,105 |
| Based on demographic estimates as of April 1, 2010 : | 14,178 |
| Based on demographic estimates as of 1 April 2010 : | -0.5% |
| April 1, 2020 Population : | 14,204 |
| April 1, 2010 Population : | 14,171 |
| People under 5 years old, percentage : | 6.0% |
| People under 18 years old, percentage : | 21.0% |
| People over 65 (%) : | 17.8% |
| Female persons, % : | 50.9% |
| White only, percent : | 93.5% |
| Black or African American alone, percent : | 4.1% |
| American Indian and Alaska Native only, % : | 0.0% |
| Asians alone % : | 0.6% |
| Only Native Hawaiians and Other Pacific Islanders, % : | 0.0% |
| % of people who have participated in two or more races : | 1.7% |
| % of Hispanic or Latino : | 2.0% |
| White people, not Hispanic or Latino people, make up the majority of the population. : | 91.8% |
| 2015-2019 Veterans : | 829 |
| Percentage of foreign-born people, 2015-2019 : | 3.3% |
| Rate of owner-occupied housing units, 2015-2019 : | 75.6% |
Economic Facts
| Rate of owner-occupied housing units, 2015-2019 : | 75.6% |
| Owner-occupied housing unit median value, 2015-2019 : | $119,100 |
| From 2015 to 2019, the median selected monthly owner costs - with a mortgage : | $1,204 |
| Monthly owner costs, without a mortgage, at the median, 2015-2019 : | $473 |
| 2015-2019 median gross rent : | $860 |
| 2015-2019 Households : | 6,126 |
| Population per household, 2015-2019 : | 2.31 |
| Living in the same house a year ago, percentage of people aged one year and up, 2015-2019 : | 91.7% |
| Languages other than English spoken at home, as a percentage of people aged 5 and up, 2015-2019 : | 4.4% |
| Households with computers, %, 2015-2019 : | 88.6% |
| Percentage of households with a broadband Internet subscription, 2015-2019 : | 81.9% |
| Percentage of people aged 25 and up with a high school diploma or higher, 2015-2019 : | 92.3% |
| Bachelor's degree or higher, proportion of people aged 25 and up, 2015-2019 : | 22.0% |
| Percentage of people under the age of 65 who have a disability, 2015-2019 : | 9.4% |
| Persons under the age of 65 who do not have health insurance, as a percentage : | 4.6% |
| Total civilian labor force, percent of population aged 16 and up, 2015-2019 : | 71.0% |
| Female labor force participation in the civilian labor force, as a percentage of the population aged 16 and up, 2015-2019 : | 64.9% |
| Total sales of lodging and food services in 2012 ($1,000) : | 16,661 |
| Total receipts/revenue for health care and social assistance in 2012 ($1,000) : | 9,404 |
| 2012 total retail sales ($1,000) : | 137,422 |
| 2012 total retail sales per capita : | $9,759 |
| Mean commute time to work (in minutes), workers aged 16 and up, 2015-2019 : | 21.3 |
| 2015-2019 median household income (in 2019 dollars) : | $62,016 |
| Income per capita in the previous 12 months (in 2019 dollars), 2015-2019 : | $30,302 |
| Percentage of people living in poverty : | 7.4% |
| Total number of businesses in 2012 : | 946 |
| Men-owned businesses in 2012 : | 593 |
| Women-owned businesses in 2012 : | 317 |
| Minority-owned businesses in 2012 : | 50 |
| Non-minority-owned businesses in 2012 : | 873 |
| Veteran-owned businesses in 2012 : | 144 |
| Nonveteran-owned businesses in 2012 : | 740 |
| 2010 population per square mile : | 5,587.0 |
| 2010 land area in square miles : | 2.54 |
Best Things to Do in Spring City
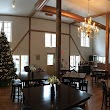
1Stone Barn Cellars Winery
3050 Pottstown Pike, Spring City, PA 19475, United States View details
Phone: +14849858077 | Website available
Nearby Schools and Colleges
Schools and campuses linked to Spring City, PA. Select a name to open its map and contact details.
| Code | Name | City | ZIP |
|---|---|---|---|
| 216542 | University of Valley Forge | Phoenixville (PA) | 19460-2373 |
Nearby Transit Stations (29)
Rail and bus stations connected to Spring City, PA. Select a station to open its map and address details.
| Code | Name | Address | Type |
|---|---|---|---|
| PAO | Paoli | 13 Lancaster Ave. | RAIL |
| EXT | Exton | 425 Walkertown Road | RAIL |
| DOW | Downingtown | West Lancaster Ave. and Stuart Ave. | RAIL |
| ARD | Ardmore | Station Road and Lancaster Ave. | RAIL |
| COT | Coatesville | Third Ave. and Fleetwood St. | RAIL |
Closest post offices linked to Spring City.
| Post Office Name | City | ZIP |
|---|---|---|
| Spring City Post Office | Spring City (PA) | 19475 |
Other places with the same name (2)
- Spring City, Tennessee human settlement in Rhea County, Tennessee, United States of America with a population of 1,839 people.
- Spring City, Utah city in Sanpete County, Utah, United States with a population of 1,080 people.
Other cities in Chester County
Cities, towns, neighborhoods & other populated places in Chester County , PA. (more)
| City Name | Population | Title |
|---|---|---|
| West Chester | 20,048 | Borough in Chester County, Pennsylvania, United States |
| Warwick | 19,576 | Township in Chester County, Pennsylvania |
| Phoenixville | 16,910 | Borough of Pennsylvania |
| Caln | 14,089 | Census-designated place in Chester County, Pennsylvania |
| Coatesville | 13,006 | City of Pennsylvania |
| Hopewell | 12,548 | Borough in Bedford County, Pennsylvania |
| New Garden | 12,237 | Township in Chester County, Pennsylvania |
| Westtown | 10,992 | Township in Chester County, Pennsylvania |
| Willistown | 10,983 | Township in Chester County, Pennsylvania |
| Downingtown | 8,419 | Borough in Chester County, Pennsylvania |
| Red Lion | 6,309 | Borough of Pennsylvania |
| Kennett Square | 6,203 | Borough in Chester County, Pennsylvania, United States |
| New London | 5,967 | Township in Chester County, Pennsylvania |
| Oxford | 5,594 | Borough of Pennsylvania |
| Paoli | 5,575 | Census designated place |
| Exton | 4,842 | Village and former civil parish in Rutland, UK |
Distance to Other Cities
Spring City distances to largest Pennsylvania cities