Shorewood, Minnesota
Shorewood: city in Hennepin County, Minnesota
About
Shorewood is a city located in the county of Hennepin in the U.S. state of Minnesota. Its population at the 2010 census was 7,307. After 10 years in 2020 city had an estimated population of 8,098 inhabitants.
The city was created 70 years ago in 1955.

Quick Facts about Shorewood
| Population | 8,098 (2020) |
| Country | United States of America |
| State | Minnesota (United States) |
| County | Hennepin County |
| Latitude & Longitude | 44.9008,-93.5891 |
| Altitude | 981 feet / 299 meters |
| Establishment | January 01, 1956 (70 years ago) |
| Time Zone | America/Chicago |
| Local time | 18:14:14 (17th July 2026) |
| Population growth | 9.77% (2010-2020) |
| Weather | 72℉ Mostly Clear 7-days weather |
Geography
Shorewood is located at 44°54'3"N 93°35'21"W (44.9008000, -93.5891200).
Shorewood map
Weather
Mostly clear, with a low around 72. South wind 0 to 5 mph.
7-Day ForecastOfficial website of Shorewood
Official WebsiteDemographics
The population of Shorewood increased by 9.77% in 10 years.
| Year | Population | % Change | Method |
|---|---|---|---|
| 2010 | 7,307 | - | census |
| 2011 | 7,374 | 0.91% | estimation process |
| 2012 | 7,461 | 1.17% | estimation process |
| 2013 | 7,522 | 0.81% | estimation process |
| 2014 | 7,563 | 0.54% | estimation process |
| 2015 | 7,622 | 0.77% | estimation process |
| 2016 | 7,684 | 0.81% | estimation process |
| 2017 | 7,927 | 3.07% | estimation process |
| 2018 | 7,968 | 0.51% | estimation process |
| 2019 | 8,071 | 1.28% | estimation process |
| 2020 | 8,098 | 0.33% | estimation process |
Demographic Facts
| Estimated population as of July 1, 2019 : | 28,454 |
| Based on demographic estimates as of April 1, 2010 : | 30,617 |
| Based on demographic estimates as of 1 April 2010 : | -7.1% |
| April 1, 2020 Population : | 28,555 |
| April 1, 2010 Population : | 30,617 |
| People under 5 years old, percentage : | 8.9% |
| People under 18 years old, percentage : | 26.0% |
| People over 65 (%) : | 15.8% |
| Female persons, % : | 51.0% |
| White only, percent : | 53.7% |
| Black or African American alone, percent : | 40.8% |
| American Indian and Alaska Native only, % : | 0.1% |
| Asians alone % : | 1.4% |
| Only Native Hawaiians and Other Pacific Islanders, % : | 0.0% |
| % of people who have participated in two or more races : | 2.9% |
| % of Hispanic or Latino : | 3.8% |
| White people, not Hispanic or Latino people, make up the majority of the population. : | 51.6% |
| 2015-2019 Veterans : | 1,427 |
| Percentage of foreign-born people, 2015-2019 : | 3.3% |
| Rate of owner-occupied housing units, 2015-2019 : | 56.1% |
Economic Facts
| Rate of owner-occupied housing units, 2015-2019 : | 56.1% |
| Owner-occupied housing unit median value, 2015-2019 : | $114,600 |
| From 2015 to 2019, the median selected monthly owner costs - with a mortgage : | $1,083 |
| Monthly owner costs, without a mortgage, at the median, 2015-2019 : | $360 |
| 2015-2019 median gross rent : | $762 |
| 2015-2019 Households : | 11,030 |
| Population per household, 2015-2019 : | 2.63 |
| Living in the same house a year ago, percentage of people aged one year and up, 2015-2019 : | 84.1% |
| Languages other than English spoken at home, as a percentage of people aged 5 and up, 2015-2019 : | 9.2% |
| Households with computers, %, 2015-2019 : | 82.6% |
| Percentage of households with a broadband Internet subscription, 2015-2019 : | 75.0% |
| Percentage of people aged 25 and up with a high school diploma or higher, 2015-2019 : | 78.7% |
| Bachelor's degree or higher, proportion of people aged 25 and up, 2015-2019 : | 16.9% |
| Percentage of people under the age of 65 who have a disability, 2015-2019 : | 15.9% |
| Persons under the age of 65 who do not have health insurance, as a percentage : | 13.5% |
| Total civilian labor force, percent of population aged 16 and up, 2015-2019 : | 58.3% |
| Female labor force participation in the civilian labor force, as a percentage of the population aged 16 and up, 2015-2019 : | 54.4% |
| Total receipts/revenue for health care and social assistance in 2012 ($1,000) : | 283,299 |
| Manufacturers' total shipments in 2012 ($1,000) : | 566,740 |
| 2012 total retail sales ($1,000) : | 743,090 |
| 2012 total retail sales per capita : | $24,090 |
| Mean commute time to work (in minutes), workers aged 16 and up, 2015-2019 : | 22.7 |
| 2015-2019 median household income (in 2019 dollars) : | $38,221 |
| Income per capita in the previous 12 months (in 2019 dollars), 2015-2019 : | $21,171 |
| Percentage of people living in poverty : | 27.3% |
| Total number of businesses in 2012 : | 3,857 |
| Men-owned businesses in 2012 : | 1,925 |
| Women-owned businesses in 2012 : | 1,514 |
| Minority-owned businesses in 2012 : | 1,664 |
| Non-minority-owned businesses in 2012 : | 1,963 |
| Veteran-owned businesses in 2012 : | 465 |
| Nonveteran-owned businesses in 2012 : | 3,130 |
| 2010 population per square mile : | 2,748.3 |
| 2010 land area in square miles : | 11.14 |
| Rate of owner-occupied housing units, 2015-2019 : | 44.2% |
| Owner-occupied housing unit median value, 2015-2019 : | $198,400 |
| From 2015 to 2019, the median selected monthly owner costs - with a mortgage : | $1,716 |
| Monthly owner costs, without a mortgage, at the median, 2015-2019 : | $694 |
| 2015-2019 median gross rent : | $895 |
| 2015-2019 Households : | 6,813 |
| Population per household, 2015-2019 : | 2.45 |
| Living in the same house a year ago, percentage of people aged one year and up, 2015-2019 : | 83.5% |
| Languages other than English spoken at home, as a percentage of people aged 5 and up, 2015-2019 : | 28.6% |
| Households with computers, %, 2015-2019 : | 86.5% |
| Percentage of households with a broadband Internet subscription, 2015-2019 : | 79.7% |
| Percentage of people aged 25 and up with a high school diploma or higher, 2015-2019 : | 82.6% |
| Bachelor's degree or higher, proportion of people aged 25 and up, 2015-2019 : | 17.2% |
| Percentage of people under the age of 65 who have a disability, 2015-2019 : | 14.5% |
| Persons under the age of 65 who do not have health insurance, as a percentage : | 3.9% |
| Total civilian labor force, percent of population aged 16 and up, 2015-2019 : | 64.7% |
| Female labor force participation in the civilian labor force, as a percentage of the population aged 16 and up, 2015-2019 : | 59.4% |
| Total sales of lodging and food services in 2012 ($1,000) : | 18,056 |
| Total receipts/revenue for health care and social assistance in 2012 ($1,000) : | 200,299 |
| Manufacturers' total shipments in 2012 ($1,000) : | 200,695 |
| 2012 total retail sales ($1,000) : | 199,725 |
| 2012 total retail sales per capita : | $11,889 |
| Mean commute time to work (in minutes), workers aged 16 and up, 2015-2019 : | 25.6 |
| 2015-2019 median household income (in 2019 dollars) : | $51,270 |
| Income per capita in the previous 12 months (in 2019 dollars), 2015-2019 : | $26,661 |
| Percentage of people living in poverty : | 20.7% |
| Total number of businesses in 2012 : | 985 |
| Men-owned businesses in 2012 : | 547 |
| Women-owned businesses in 2012 : | 280 |
| Minority-owned businesses in 2012 : | 160 |
| Non-minority-owned businesses in 2012 : | 702 |
| Veteran-owned businesses in 2012 : | 121 |
| Nonveteran-owned businesses in 2012 : | 715 |
| 2010 population per square mile : | 824.6 |
| 2010 land area in square miles : | 20.28 |
Services and Civic Places in Shorewood
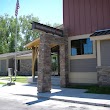
1Shorewood City Hall
5755 Country Club Rd, Shorewood, MN 55331 View details
Phone: +19529607900 | Website available
People born in Shorewood (1)
American ice hockey goaltender John Curry was born in Shorewood
Nearby Schools and Colleges
Schools and campuses linked to Shorewood, MN. Select a name to open its map and contact details.
| Code | Name | City | ZIP |
|---|---|---|---|
| 174862 | Crown College | Saint Bonifacius (MN) | 55375-9001 |
Nearby Transit Stations (3)
Rail and bus stations connected to Shorewood, MN. Select a station to open its map and address details.
| Code | Name | Address | Type |
|---|---|---|---|
| MSP | Saint Paul Union Depot | Midway Station | RAIL |
| SCD | St. Cloud | 555 East St. Germain Street | RAIL |
| RDW | Red Wing station | 420 Levee Street | RAIL |
Closest post offices linked to Shorewood.
| Post Office Name | City | ZIP |
|---|---|---|
| Excelsior Post Office | Excelsior (MN) | 55331 |
Other places with the same name (2)
- Shorewood, Illinois village in Illinois with a population of 17,495 people.
- Shorewood, Wisconsin village in Milwaukee County, Wisconsin with a population of 13,117 people.
Other cities in Hennepin County
Cities, towns, neighborhoods & other populated places in Hennepin County , MN. (more)
| City Name | Population | Title |
|---|---|---|
| Minneapolis | 433,111 | The largest city in Minnesota, Minneapolis is a major center for business, finance, and culture. |
| Bloomington | 84,583 | The most populous city in Hennepin County, Minnesota. |
| Plymouth | 79,635 | The second most populous city in Hennepin County, Minnesota. |
| Brooklyn Park | 79,574 | The third most populous city in Hennepin County, Minnesota. |
| Maple Grove | 72,881 | The second most populous city in Hennepin County, Minnesota. |
| Eden Prairie | 64,894 | The most populous city in Hennepin County, Minnesota. |
| West Co on Rapids | 62,528 | A city in Anoka County, Minnesota. |
| Minnetonka | 55,370 | The most populous city in Hennepin County, Minnesota. |
| Edina | 52,477 | The most populous city in Hennepin County, Minnesota. |
| Minnetonka Mills | 50,117 | A city in Hennepin County, Minnesota. |
| Saint Louis Park | 48,821 | The most populous city in Hennepin County, Minnesota. |
| Richfield | 36,237 | City in Hennepin County, Minnesota, United States |
| Brooklyn Center | 30,253 | City in Hennepin County, Minnesota |
| Champlin | 25,049 | City in Hennepin County, Minnesota |
| Crystal | 22,581 | City in Hennepin County, Minnesota, United States |
| New Hope | 20,641 | City in Hennepin County, Minnesota |
Distance to Other Cities
Shorewood distances to largest Minnesota cities