Richland, Iowa
Richland: city in Keokuk County, Iowa
About
Richland is a city located in the county of Keokuk in the U.S. state of Iowa. Its population at the 2010 census was 584 and a population density of 294 people per km². After 10 years in 2020 city had an estimated population of 582 inhabitants.

Quick Facts about Richland
| Population | 582 (2020) |
| Country | United States of America |
| State | Iowa (United States) |
| County | Keokuk County |
| Postal code | 52585 |
| Area | 1.99 km2 |
| Latitude & Longitude | 41.1856,-91.9930 |
| Altitude | 771 feet / 235 meters |
| Time Zone | America/Chicago |
| Local time | 20:28:14 (14th July 2026) |
| Density | 293 Pop. per km² as of 2020 |
| Population growth | -0.34% (2010-2020) |
| Weather | 92℉ Sunny 7-days weather |

Geography
Richland is located at 41°11'8"N 91°59'35"W (41.1855700, -91.9929500).
Richland map
Demographics
According to census records, the population of Richland decreased by 0.34% in 10 years.
| Year | Population | % Change | Method |
|---|---|---|---|
| 2010 | 584 | - | census |
| 2011 | 576 | -1.39% | estimation process |
| 2012 | 578 | 0.35% | estimation process |
| 2013 | 572 | -1.05% | estimation process |
| 2014 | 572 | 0% | estimation process |
| 2015 | 565 | -1.24% | estimation process |
| 2016 | 566 | 0.18% | estimation process |
| 2017 | 562 | -0.71% | estimation process |
| 2018 | 567 | 0.88% | estimation process |
| 2019 | 574 | 1.22% | estimation process |
| 2020 | 582 | 1.37% | estimation process |
Demographic Facts
| Estimated population as of July 1, 2019 : | 20,997 |
| Based on demographic estimates as of April 1, 2010 : | 21,688 |
| Based on demographic estimates as of 1 April 2010 : | -3.2% |
| April 1, 2020 Population : | 20,770 |
| April 1, 2010 Population : | 21,699 |
| People under 5 years old, percentage : | 4.7% |
| People under 18 years old, percentage : | 18.6% |
| People over 65 (%) : | 26.3% |
| Female persons, % : | 50.2% |
| White only, percent : | 96.3% |
| Black or African American alone, percent : | 0.4% |
| American Indian and Alaska Native only, % : | 1.0% |
| Asians alone % : | 0.6% |
| Only Native Hawaiians and Other Pacific Islanders, % : | Z |
| % of people who have participated in two or more races : | 1.6% |
| % of Hispanic or Latino : | 2.3% |
| White people, not Hispanic or Latino people, make up the majority of the population. : | 94.3% |
| 2015-2019 Veterans : | 1,798 |
| Percentage of foreign-born people, 2015-2019 : | 1.3% |
| Residential units, July 1, 2019 : | 16,252 |
Economic Facts
| Residential units, July 1, 2019 : | 16,252 |
| Rate of owner-occupied housing units, 2015-2019 : | 81.4% |
| Owner-occupied housing unit median value, 2015-2019 : | $98,200 |
| From 2015 to 2019, the median selected monthly owner costs - with a mortgage : | $950 |
| Monthly owner costs, without a mortgage, at the median, 2015-2019 : | $385 |
| 2015-2019 median gross rent : | $701 |
| Permits for construction, 2020 : | 20 |
| 2015-2019 Households : | 9,184 |
| Population per household, 2015-2019 : | 2.24 |
| Living in the same house a year ago, percentage of people aged one year and up, 2015-2019 : | 87.8% |
| Languages other than English spoken at home, as a percentage of people aged 5 and up, 2015-2019 : | 2.0% |
| Households with computers, %, 2015-2019 : | 83.9% |
| Percentage of households with a broadband Internet subscription, 2015-2019 : | 73.6% |
| Percentage of people aged 25 and up with a high school diploma or higher, 2015-2019 : | 85.9% |
| Bachelor's degree or higher, proportion of people aged 25 and up, 2015-2019 : | 12.2% |
| Percentage of people under the age of 65 who have a disability, 2015-2019 : | 17.3% |
| Persons under the age of 65 who do not have health insurance, as a percentage : | 8.7% |
| Total civilian labor force, percent of population aged 16 and up, 2015-2019 : | 47.1% |
| Female labor force participation in the civilian labor force, as a percentage of the population aged 16 and up, 2015-2019 : | 44.8% |
| Total sales of lodging and food services in 2012 ($1,000) : | 38,050 |
| Total receipts/revenue for health care and social assistance in 2012 ($1,000) : | 102,583 |
| Manufacturers' total shipments in 2012 ($1,000) : | 78,984 |
| 2012 total retail sales ($1,000) : | 387,590 |
| 2012 total retail sales per capita : | $18,080 |
| Mean commute time to work (in minutes), workers aged 16 and up, 2015-2019 : | 24.6 |
| 2015-2019 median household income (in 2019 dollars) : | $40,373 |
| Income per capita in the previous 12 months (in 2019 dollars), 2015-2019 : | $23,787 |
| Percentage of people living in poverty : | 18.2% |
| Total number of employer establishments, 2019 : | 568 |
| 2019 total employment : | 5,348 |
| 2019 total annual payroll ($1,000) : | 188,948 |
| Total employment, change in percentage terms, 2018-2019 : | 0.1% |
| 2018 total non-employer establishments : | 1,306 |
| Total number of businesses in 2012 : | 1,659 |
| Men-owned businesses in 2012 : | 701 |
| Women-owned businesses in 2012 : | 661 |
| Minority-owned businesses in 2012 : | 31 |
| Non-minority-owned businesses in 2012 : | 1,521 |
| Veteran-owned businesses in 2012 : | 114 |
| Nonveteran-owned businesses in 2012 : | 1,458 |
| 2010 population per square mile : | 38.5 |
| 2010 land area in square miles : | 563.49 |
| Residential units, July 1, 2019 : | 564,325 |
| Rate of owner-occupied housing units, 2015-2019 : | 53.4% |
| Owner-occupied housing unit median value, 2015-2019 : | $175,100 |
| From 2015 to 2019, the median selected monthly owner costs - with a mortgage : | $1,470 |
| Monthly owner costs, without a mortgage, at the median, 2015-2019 : | $598 |
| 2015-2019 median gross rent : | $974 |
| Permits for construction, 2020 : | 8,108 |
| 2015-2019 Households : | 511,447 |
| Population per household, 2015-2019 : | 2.47 |
| Living in the same house a year ago, percentage of people aged one year and up, 2015-2019 : | 80.8% |
| Languages other than English spoken at home, as a percentage of people aged 5 and up, 2015-2019 : | 13.5% |
| Households with computers, %, 2015-2019 : | 92.9% |
| Percentage of households with a broadband Internet subscription, 2015-2019 : | 87.2% |
| Percentage of people aged 25 and up with a high school diploma or higher, 2015-2019 : | 91.2% |
| Bachelor's degree or higher, proportion of people aged 25 and up, 2015-2019 : | 40.0% |
| Percentage of people under the age of 65 who have a disability, 2015-2019 : | 8.4% |
| Persons under the age of 65 who do not have health insurance, as a percentage : | 8.9% |
| Total civilian labor force, percent of population aged 16 and up, 2015-2019 : | 70.0% |
| Female labor force participation in the civilian labor force, as a percentage of the population aged 16 and up, 2015-2019 : | 65.6% |
| Total sales of lodging and food services in 2012 ($1,000) : | 2,980,798 |
| Total receipts/revenue for health care and social assistance in 2012 ($1,000) : | 11,693,144 |
| Manufacturers' total shipments in 2012 ($1,000) : | 12,574,063 |
| 2012 total retail sales ($1,000) : | 21,384,872 |
| 2012 total retail sales per capita : | $17,887 |
| Mean commute time to work (in minutes), workers aged 16 and up, 2015-2019 : | 22.2 |
| 2015-2019 median household income (in 2019 dollars) : | $61,305 |
| Income per capita in the previous 12 months (in 2019 dollars), 2015-2019 : | $33,998 |
| Percentage of people living in poverty : | 13.5% |
| Total number of employer establishments, 2019 : | 29,192 |
| 2019 total employment : | 670,124 |
| 2019 total annual payroll ($1,000) : | 36,274,812 |
| Total employment, change in percentage terms, 2018-2019 : | 0.8% |
| 2018 total non-employer establishments : | 103,069 |
| Total number of businesses in 2012 : | 107,363 |
| Men-owned businesses in 2012 : | 57,860 |
| Women-owned businesses in 2012 : | 40,290 |
| Minority-owned businesses in 2012 : | 27,075 |
| Non-minority-owned businesses in 2012 : | 76,160 |
| Veteran-owned businesses in 2012 : | 9,832 |
| Nonveteran-owned businesses in 2012 : | 92,234 |
| 2010 population per square mile : | 2,186.1 |
| 2010 land area in square miles : | 532.19 |
Services and Civic Places in Richland
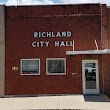
1Richland City Hall
109 Richland St, Richland, IA 52585 View details
Phone: +13194562511 | Website available
People born in Richland (2)
People born in Richland, including Canadian politician Daniel Webster Warner, collegiate football coach Mark Hendrickson, .
More notable people
Nearby Schools and Colleges
Schools and campuses linked to Richland, IA. Select a name to open its map and contact details.
| Code | Name | City | ZIP |
|---|---|---|---|
| 153861 | Maharishi University of Management | Fairfield (IA) | 52557 |
Nearby Transit Stations (4)
Rail and bus stations connected to Richland, IA. Select a station to open its map and address details.
| Code | Name | Address | Type |
|---|---|---|---|
| OTM | Ottumwa station | 210 West Main Street | RAIL |
| MTP | Mount Pleasant | 418 North Adams Street | RAIL |
| FMD | Fort Madison station | 1601 20th Street | RAIL |
| BRL | Burlington | 300 South Main Street | RAIL |
Closest post offices linked to Richland.
| Post Office Name | City | ZIP |
|---|---|---|
| Richland Post Office | Richland (IA) | 52585 |
Other places with the same name (16)
- Richland, Washington The most populous city in Benton County, Washington. with a population of 59,439 people.
- Richland, Mississippi city in Rankin County, Mississippi with a population of 7,270 people.
- Richland, Mississippi city in Rankin County, Mississippi with a population of 7,087 people.
- Richland, New York town in New York, United States with a population of 5,526 people.
- Richland, Missouri city in Missouri parts of witch are in Camden, Laclede, and Pulaski Counties with a population of 1,800 people.
- Richland, Indiana unincorporated community in Rush County, Indiana with a population of 1,796 people.
- Richland, Georgia human settlement in Stewart County, Georgia, United States of America with a population of 1,655 people.
- Richland, Pennsylvania borough in southeastern Lebanon County, Pennsylvania with a population of 1,614 people.
- Richland, Michigan village in Kalamazoo County, Michigan with a population of 847 people.
- Richland, Ohio human settlement in United States of America with a population of 807 people.
- Richland, Illinois township in Richland County, Illinois with a population of 718 people.
- Richland, Texas town in Navarro County, Texas with a population of 273 people.
- Richland, Oregon city in Oregon, USA with a population of 176 people.
- Richland, South Dakota unincorporated community in South Dakota with a population of 159 people.
- Richland, Nebraska city in Colfax County, Nebraska, United States of America with a population of 71 people.
- Richland, Kansas ghost town in Kansas, United States with a population of 27 people.
Other cities in Keokuk County
Cities, towns, neighborhoods & other populated places in Keokuk County , IA.
| City Name | Population | Title |
|---|---|---|
| Sigourney | 1,980 | City in Iowa |
| Keota | 958 | Human settlement in Keokuk County, Iowa, United States of America |
| Hedrick | 743 | City in Keokuk County, Iowa, United States |
| What Cheer | 615 | City in Iowa |
| Delta | 313 | City in Iowa, United States |
| Keswick | 237 | City in Keokuk County, Iowa, United States of America |
| South English | 211 | City in Keokuk County, Iowa, United States |
| Ollie | 207 | Human settlement in Keokuk County, Iowa, United States of America |
| Harper | 107 | City in Iowa, USA |
| Martinsburg | 107 | Town in Keokuk County, Iowa, United States |
| Kinross | 71 | City in Iowa |
| Webster | 71 | City in Keokuk County, Iowa, United States |
| Thornburg | 67 | Human settlement in Keokuk County, Iowa, United States of America |
| Gibson | 59 | City in Iowa |
| Hayesville | 48 | Human settlement in Keokuk County, Iowa, United States of America |