Prescott Valley, Arizona
Prescott Valley: town of the United States
About
Prescott Valley is a town located in the county of Yavapai in the U.S. state of Arizona. Its population at the 2010 census was 38,822. After 10 years in 2020 city had an estimated population of 47,901 inhabitants.
The town was created 48 years ago in 1977.

Quick Facts about Prescott Valley
| Population | 47,901 (2020) |
| Country | United States of America |
| State | Arizona (United States) |
| County | Yavapai County |
| Different from | Prescott |
| Phone Area Codes | 928 |
| Water as percent of area | 0% |
| Land as percent of area | 100% |
| Latitude & Longitude | 34.6100,-112.3157 |
| Altitude | 5,026 feet / 1532 meters |
| Establishment | January 01, 1978 (48 years ago) |
| Time Zone | Mountain Time Zone |
| Local time | 18:09:29 (17th July 2026) |
| Postal code | 86314 |
| Population growth | 18.95% (2010-2020) |
| Weather | 78℉ Showers And Thunderstorms 7-days weather |

Geography
Prescott Valley is located at 34°36'36"N 112°18'57"W (34.6100200, -112.3157200).
Prescott Valley map
Weather
Showers and thunderstorms before 5pm, then a chance of showers and thunderstorms. Mostly cloudy. High near 78, with temperatures falling to around 76...
7-Day ForecastOfficial website of Prescott Valley
Official WebsiteDemographics
The population of Prescott Valley increased by 18.95% in 10 years.
| Year | Population | % Change | Method |
|---|---|---|---|
| 2010 | 38,822 | - | census |
| 2011 | 38,778 | -0.11% | estimation process |
| 2012 | 39,110 | 0.85% | estimation process |
| 2013 | 39,888 | 1.95% | estimation process |
| 2014 | 40,909 | 2.5% | estimation process |
| 2015 | 41,953 | 2.49% | estimation process |
| 2016 | 42,955 | 2.33% | estimation process |
| 2017 | 44,453 | 3.37% | estimation process |
| 2018 | 45,703 | 2.74% | estimation process |
| 2019 | 46,515 | 1.75% | estimation process |
| 2020 | 47,901 | 2.89% | estimation process |
Demographic Facts
| Estimated population as of July 1, 2019 : | 46,429 |
| Based on demographic estimates as of April 1, 2010 : | 49,117 |
| Based on demographic estimates as of 1 April 2010 : | -5.5% |
| April 1, 2020 Population : | 46,460 |
| April 1, 2010 Population : | 49,116 |
| People under 5 years old, percentage : | 6.1% |
| People under 18 years old, percentage : | 22.7% |
| People over 65 (%) : | 19.9% |
| Female persons, % : | 50.9% |
| White only, percent : | 93.8% |
| Black or African American alone, percent : | 3.1% |
| American Indian and Alaska Native only, % : | 0.4% |
| Asians alone % : | 0.7% |
| Only Native Hawaiians and Other Pacific Islanders, % : | Z |
| % of people who have participated in two or more races : | 2.0% |
| % of Hispanic or Latino : | 3.3% |
| White people, not Hispanic or Latino people, make up the majority of the population. : | 90.9% |
| 2015-2019 Veterans : | 3,555 |
| Percentage of foreign-born people, 2015-2019 : | 1.4% |
| Residential units, July 1, 2019 : | 22,226 |
Economic Facts
| Residential units, July 1, 2019 : | 22,226 |
| Rate of owner-occupied housing units, 2015-2019 : | 73.3% |
| Owner-occupied housing unit median value, 2015-2019 : | $118,100 |
| From 2015 to 2019, the median selected monthly owner costs - with a mortgage : | $1,139 |
| Monthly owner costs, without a mortgage, at the median, 2015-2019 : | $483 |
| 2015-2019 median gross rent : | $683 |
| Permits for construction, 2020 : | 56 |
| 2015-2019 Households : | 19,635 |
| Population per household, 2015-2019 : | 2.35 |
| Living in the same house a year ago, percentage of people aged one year and up, 2015-2019 : | 86.2% |
| Languages other than English spoken at home, as a percentage of people aged 5 and up, 2015-2019 : | 1.9% |
| Households with computers, %, 2015-2019 : | 83.0% |
| Percentage of households with a broadband Internet subscription, 2015-2019 : | 77.1% |
| Percentage of people aged 25 and up with a high school diploma or higher, 2015-2019 : | 90.9% |
| Bachelor's degree or higher, proportion of people aged 25 and up, 2015-2019 : | 17.9% |
| Percentage of people under the age of 65 who have a disability, 2015-2019 : | 9.4% |
| Persons under the age of 65 who do not have health insurance, as a percentage : | 5.2% |
| Total civilian labor force, percent of population aged 16 and up, 2015-2019 : | 62.0% |
| Female labor force participation in the civilian labor force, as a percentage of the population aged 16 and up, 2015-2019 : | 58.6% |
| Total sales of lodging and food services in 2012 ($1,000) : | 103,536 |
| Total receipts/revenue for health care and social assistance in 2012 ($1,000) : | 247,997 |
| Manufacturers' total shipments in 2012 ($1,000) : | 4,731,113 |
| 2012 total retail sales ($1,000) : | 652,109 |
| 2012 total retail sales per capita : | $13,386 |
| Mean commute time to work (in minutes), workers aged 16 and up, 2015-2019 : | 19.8 |
| 2015-2019 median household income (in 2019 dollars) : | $51,688 |
| Income per capita in the previous 12 months (in 2019 dollars), 2015-2019 : | $28,483 |
| Percentage of people living in poverty : | 13.1% |
| Total number of employer establishments, 2019 : | 1,139 |
| 2019 total employment : | 17,023 |
| 2019 total annual payroll ($1,000) : | 692,682 |
| Total employment, change in percentage terms, 2018-2019 : | 0.2% |
| 2018 total non-employer establishments : | 2,613 |
| Total number of businesses in 2012 : | 4,284 |
| Men-owned businesses in 2012 : | 2,222 |
| Women-owned businesses in 2012 : | 1,317 |
| Minority-owned businesses in 2012 : | 146 |
| Non-minority-owned businesses in 2012 : | 3,913 |
| Veteran-owned businesses in 2012 : | 377 |
| Nonveteran-owned businesses in 2012 : | 3,588 |
| 2010 population per square mile : | 70.7 |
| 2010 land area in square miles : | 694.92 |
| Rate of owner-occupied housing units, 2015-2019 : | 58.5% |
| Owner-occupied housing unit median value, 2015-2019 : | $68,200 |
| From 2015 to 2019, the median selected monthly owner costs - with a mortgage : | $1,006 |
| Monthly owner costs, without a mortgage, at the median, 2015-2019 : | $424 |
| 2015-2019 median gross rent : | $926 |
| 2015-2019 Households : | 9,359 |
| Population per household, 2015-2019 : | 2.38 |
| Living in the same house a year ago, percentage of people aged one year and up, 2015-2019 : | 86.9% |
| Languages other than English spoken at home, as a percentage of people aged 5 and up, 2015-2019 : | 3.2% |
| Households with computers, %, 2015-2019 : | 87.8% |
| Percentage of households with a broadband Internet subscription, 2015-2019 : | 79.1% |
| Percentage of people aged 25 and up with a high school diploma or higher, 2015-2019 : | 89.2% |
| Bachelor's degree or higher, proportion of people aged 25 and up, 2015-2019 : | 14.7% |
| Percentage of people under the age of 65 who have a disability, 2015-2019 : | 14.1% |
| Persons under the age of 65 who do not have health insurance, as a percentage : | 5.5% |
| Total civilian labor force, percent of population aged 16 and up, 2015-2019 : | 65.4% |
| Female labor force participation in the civilian labor force, as a percentage of the population aged 16 and up, 2015-2019 : | 63.6% |
| Total sales of lodging and food services in 2012 ($1,000) : | 18,567 |
| Total receipts/revenue for health care and social assistance in 2012 ($1,000) : | 38,448 |
| Manufacturers' total shipments in 2012 ($1,000) : | 60,912 |
| 2012 total retail sales ($1,000) : | 313,069 |
| 2012 total retail sales per capita : | $13,707 |
| Mean commute time to work (in minutes), workers aged 16 and up, 2015-2019 : | 24.5 |
| 2015-2019 median household income (in 2019 dollars) : | $42,805 |
| Income per capita in the previous 12 months (in 2019 dollars), 2015-2019 : | $22,027 |
| Percentage of people living in poverty : | 21.6% |
| Total number of businesses in 2012 : | 1,552 |
| Men-owned businesses in 2012 : | 679 |
| Women-owned businesses in 2012 : | 765 |
| Minority-owned businesses in 2012 : | 856 |
| Non-minority-owned businesses in 2012 : | 638 |
| Veteran-owned businesses in 2012 : | 105 |
| Nonveteran-owned businesses in 2012 : | 1,384 |
| 2010 population per square mile : | 4,473.6 |
| 2010 land area in square miles : | 5.17 |
Where to Eat in Prescott Valley
1Encanto Italian Grill
8400 E Long Mesa Dr, Prescott Valley, AZ 86314 View details
Phone: +19287755500 | Website available
Where to Stay in Prescott Valley
1Super 8 by Wyndham Prescott Valley
7801 AZ-69, Prescott Valley, AZ 86314 View details
Phone: +19287755888 | Website available

Services and Civic Places in Prescott Valley
1Prescott Valley Civic Center
7501 Civic Cir, Prescott Valley, AZ 86314 View details
Phone: +19287593000 | Website available

2Arizona Department of Economic Security
3274 Bob Dr, Prescott Valley, AZ 86314 View details
Phone: +19287591867 | Website available

3Prescott Valley Animal Control
7601 Civic Cir, Prescott Valley, AZ 86314 View details
Phone: +19287729267 | Website available
4Prescott Valley Parks & Recreation Department
7501 Civic Cir, Prescott Valley, AZ 86314 View details
Phone: +19287593090 | Website available
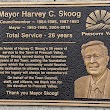
5The Town of Prescott Valley Arizona
7501 Skoog Blvd, Prescott Valley, AZ 86314 View details
Phone: +19287593000 | Website available
6Town of Prescott Valley Civic Center
7501 Skoog Blvd, Prescott Valley, AZ 86314 View details
Website available
7Division of Developmental Disabilities - DES
3274 Bob Dr, Prescott Valley, AZ 86314 View details
Phone: +19287591867 | Website available
8Prescott Valley Business Lcns
7501 Civic Cir, Prescott Valley, AZ 86314 View details
Phone: +19287593135
9Town of Prescott Valley - City Yards
11218 US-58 BUS, Prescott Valley, AZ 86314 View details
Phone: +19287755580 | Website available
People born in Prescott Valley (2)
People born in Prescott Valley, including swimmer Elizabeth Marks, Tex Keith is an amercian entrepreneur and motivational speaker. He has given a Ted Talk and is the CEO of the marketing and coaching company, Inertial Media. Tex Keith, .
More notable people
Nearby Schools and Colleges
Schools and campuses linked to Prescott Valley, AZ. Select a name to open its map and contact details.
| Code | Name | City | ZIP |
|---|---|---|---|
| 104586 | Embry-Riddle Aeronautical University-Prescott | Prescott (AZ) | 86301-3720 |
Nearby Transit Stations (7)
Rail and bus stations connected to Prescott Valley, AZ. Select a station to open its map and address details.
| Code | Name | Address | Type |
|---|---|---|---|
| CVD | Camp Verde, Arizona | 1613 Finnie Flats Rd | BUS |
| SDC | Sedona (Center Bus Stop), Arizona | 300 North Highway 89A | BUS |
| WMA | Williams, Arizona | 233 North Grand Canyon Blvd | BUS |
| WMJ | Williams Junction, Arizona | No address. Reserve from WMA. | RAIL |
| FGG | Flagstaff (Greyhound), Arizona | 399 S. Malpais Ln. | BUS |
Closest post offices linked to Prescott Valley.
| Post Office Name | City | ZIP |
|---|---|---|
| Prescott Valley Post Office | Prescott Valley (AZ) | 86314 |
Other cities in Yavapai County
Cities, towns, neighborhoods & other populated places in Yavapai County , AZ. (more)
| City Name | Population | Title |
|---|---|---|
| Prescott | 44,837 | A city in Yavapai County, Arizona. |
| Chino Valley | 12,819 | Town in Yavapai County, Arizona, United States |
| Cottonwood | 11,818 | City in Yavapai County, Arizona, United States |
| West Sedona | 11,299 | City in Yavapai County, Arizona, United States of America |
| Camp Verde | 11,259 | Town of the United States |
| Big Park | 6,695 | Park in Uintah County, Utah, United States of America |
| Williamson | 5,438 | Census designated place |
| Paulden | 5,231 | Census-designated place in Yavapai County, Arizona |
| Lake Montezuma | 4,706 | Census-designated place in Yavapai County, Arizona |
| Clarkdale | 4,525 | Town of the United States |
| Cornville | 3,280 | Settlement/census place in Arizona |
| Black Canyon City | 2,837 | Census designated place |
| Cordes Lakes | 2,633 | Census-designated place in Yavapai County, Arizona |
| Congress | 1,975 | Census-designated Yavapai County, Arizona, United States |
| Mayer | 1,497 | Census-designated place in Yavapai County, Arizona |
| Jerome | 459 | Town in Arizona, United States |
Distance to Other Cities
Prescott Valley distances to largest Arizona cities