Matewan, West Virginia
Matewan: human settlement in Mingo County, West Virginia, United States of America
About
Matewan is a city located in the county of Mingo in the U.S. state of West Virginia. Its population at the 2010 census was 499 and a population density of 349 people per km². After 10 years in 2020 city had an estimated population of 415 inhabitants.
Quick Facts about Matewan
| Population | 415 (2020) |
| Country | United States of America |
| State | West Virginia (United States) |
| County | Mingo County |
| Different from | Matewan |
| Postal code | 25678 |
| Phone Area Codes | 304 |
| Area | 1.43 km2 |
| Latitude & Longitude | 37.6221,-82.1632 |
| Altitude | 705 feet / 215, 215 meters |
| Time Zone | America/New_York |
| Local time | 07:56:58 (27th June 2026) |
| Density | 290 Pop. per km² as of 2020 |
| Population growth | -20.24% (2010-2020) |
| Weather | 81℉ Showers And Thunderstorms 7-days weather |
Geography
Matewan is located at 37°37'19"N 82°9'47"W (37.6220500, -82.1631900).
Matewan map
Weather
Showers and thunderstorms. Cloudy, with a high near 81. Chance of precipitation is 90%.
7-Day ForecastDemographics
According to census records, the population of Matewan decreased by 20.24% in 10 years.
| Year | Population | % Change | Method |
|---|---|---|---|
| 2010 | 499 | - | census |
| 2011 | 495 | -0.81% | estimation process |
| 2012 | 485 | -2.06% | estimation process |
| 2013 | 481 | -0.83% | estimation process |
| 2014 | 473 | -1.69% | estimation process |
| 2015 | 465 | -1.72% | estimation process |
| 2016 | 451 | -3.1% | estimation process |
| 2017 | 440 | -2.5% | estimation process |
| 2018 | 432 | -1.85% | estimation process |
| 2019 | 424 | -1.89% | estimation process |
| 2020 | 415 | -2.17% | estimation process |
Demographic Facts
| Estimated population as of July 1, 2019 : | 182,799 |
| Based on demographic estimates as of April 1, 2010 : | 170,322 |
| Based on demographic estimates as of 1 April 2010 : | 7.3% |
| April 1, 2020 Population : | 181,099 |
| April 1, 2010 Population : | 167,674 |
| People under 5 years old, percentage : | 5.9% |
| People under 18 years old, percentage : | 19.5% |
| People over 65 (%) : | 16.6% |
| Female persons, % : | 53.2% |
| White only, percent : | 62.3% |
| Black or African American alone, percent : | 31.4% |
| American Indian and Alaska Native only, % : | 0.2% |
| Asians alone % : | 2.7% |
| Only Native Hawaiians and Other Pacific Islanders, % : | 0.0% |
| % of people who have participated in two or more races : | 2.4% |
| % of Hispanic or Latino : | 6.3% |
| White people, not Hispanic or Latino people, make up the majority of the population. : | 57.3% |
| 2015-2019 Veterans : | 9,889 |
| Percentage of foreign-born people, 2015-2019 : | 6.4% |
| Rate of owner-occupied housing units, 2015-2019 : | 52.6% |
Economic Facts
| Rate of owner-occupied housing units, 2015-2019 : | 52.6% |
| Owner-occupied housing unit median value, 2015-2019 : | $167,500 |
| From 2015 to 2019, the median selected monthly owner costs - with a mortgage : | $1,228 |
| Monthly owner costs, without a mortgage, at the median, 2015-2019 : | $442 |
| 2015-2019 median gross rent : | $859 |
| 2015-2019 Households : | 75,940 |
| Population per household, 2015-2019 : | 2.25 |
| Living in the same house a year ago, percentage of people aged one year and up, 2015-2019 : | 83.6% |
| Languages other than English spoken at home, as a percentage of people aged 5 and up, 2015-2019 : | 8.8% |
| Households with computers, %, 2015-2019 : | 85.4% |
| Percentage of households with a broadband Internet subscription, 2015-2019 : | 77.5% |
| Percentage of people aged 25 and up with a high school diploma or higher, 2015-2019 : | 87.5% |
| Bachelor's degree or higher, proportion of people aged 25 and up, 2015-2019 : | 30.0% |
| Percentage of people under the age of 65 who have a disability, 2015-2019 : | 10.8% |
| Persons under the age of 65 who do not have health insurance, as a percentage : | 12.4% |
| Total civilian labor force, percent of population aged 16 and up, 2015-2019 : | 61.9% |
| Female labor force participation in the civilian labor force, as a percentage of the population aged 16 and up, 2015-2019 : | 57.9% |
| Total sales of lodging and food services in 2012 ($1,000) : | 763,505 |
| Total receipts/revenue for health care and social assistance in 2012 ($1,000) : | 2,891,412 |
| Manufacturers' total shipments in 2012 ($1,000) : | 10,598,082 |
| 2012 total retail sales ($1,000) : | 4,359,074 |
| 2012 total retail sales per capita : | $25,450 |
| Mean commute time to work (in minutes), workers aged 16 and up, 2015-2019 : | 19.4 |
| 2015-2019 median household income (in 2019 dollars) : | $45,527 |
| Income per capita in the previous 12 months (in 2019 dollars), 2015-2019 : | $30,592 |
| Percentage of people living in poverty : | 17.6% |
| Total number of businesses in 2012 : | 16,348 |
| Men-owned businesses in 2012 : | 8,929 |
| Women-owned businesses in 2012 : | 5,355 |
| Minority-owned businesses in 2012 : | 3,574 |
| Non-minority-owned businesses in 2012 : | 11,752 |
| Veteran-owned businesses in 2012 : | 1,578 |
| Nonveteran-owned businesses in 2012 : | 13,567 |
| 2010 population per square mile : | 1,222.5 |
| 2010 land area in square miles : | 137.15 |
Best Things to Do in Matewan
1Matewan Depot Replica Welcome Center and Museum
328 WV-49, Matewan, WV 25678, United States View details
Phone: +13044265744 | Website available

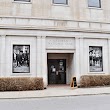
2West Virginia Mine Wars Museum
401 Mate St, Matewan, WV 25678, United States View details
Phone: +13046910014 | Website available
Nearby Schools and Colleges
Schools and campuses linked to Matewan, WV. Select a name to open its map and contact details.
| Code | Name | City | ZIP |
|---|---|---|---|
| 486202 | Mingo Extended Learning Center | Delbarton (WV) | 25670-9797 |
Nearby Transit Stations (7)
Rail and bus stations connected to Matewan, WV. Select a station to open its map and address details.
| Code | Name | Address | Type |
|---|---|---|---|
| HUN | Huntington | 1050 8th Avenue | RAIL |
| CHW | Charleston | 350 MacCorkle Avenue - Southeast | RAIL |
| MNG | Montgomery | Third Avenue and Washington Street | RAIL |
| PRC | Prince | Hwy 41 and County Road 25 | RAIL |
| THN | Thurmond | Hwy 25 & Hwy 2 | RAIL |
Closest post offices linked to Matewan.
| Post Office Name | City | ZIP |
|---|---|---|
| Matewan Post Office | Matewan (WV) | 25678 |
Other cities in Mingo County
Cities, towns, neighborhoods & other populated places in Mingo County , WV.
| City Name | Population | Title |
|---|---|---|
| Williamson | 2,616 | County seat of Mingo County, West Virginia, United States |
| Gilbert Creek | 1,090 | Census-designated place in Mingo County, West Virginia |
| Chattaroy | 756 | Census-designated place in Mingo County, West Virginia |
| Delbarton | 487 | Town in Mingo County, West Virginia, United States |
| Gilbert | 378 | Town in West Virginia |
| Kermit | 341 | Town in Mingo County, West Virginia, United States |