Mackinac Island, Michigan
Mackinac Island: city located on Mackinac Island in Michigan
About
Mackinac Island is a city located in the county of Mackinac in the U.S. state of Michigan. Its population at the 2010 census was 492 and a population density of 10 people per km². After 10 years in 2020 city had an estimated population of 478 inhabitants.
The city was created 355 years ago in 1670.
Quick Facts about Mackinac Island
| Population | 478 (2020) |
| Country | United States of America |
| State | Michigan (United States) |
| County | Mackinac County |
| Different from | Mackinac Island |
| Postal code | 49757 |
| Phone Area Codes | 906 |
| Area | 48.8 km2 |
| Latitude & Longitude | 45.8492,-84.6189 |
| Altitude | 594 feet / 181 meters |
| Establishment | January 01, 1671 (355 years ago) |
| Time Zone | America/Detroit |
| Local time | 21:09:04 (14th July 2026) |
| Density | 10 Pop. per km² as of 2020 |
| Population growth | -2.93% (2010-2020) |
Geography
Mackinac Island is located at 45°50'57"N 84°37'8"W (45.8491800, -84.6189300).
Mackinac Island map
Official website of Mackinac Island
Official WebsiteDemographics
According to census records, the population of Mackinac Island decreased by 2.93% in 10 years.
| Year | Population | % Change | Method |
|---|---|---|---|
| 2010 | 492 | - | census |
| 2011 | 488 | -0.82% | estimation process |
| 2012 | 489 | 0.2% | estimation process |
| 2013 | 486 | -0.62% | estimation process |
| 2014 | 485 | -0.21% | estimation process |
| 2015 | 477 | -1.68% | estimation process |
| 2016 | 472 | -1.06% | estimation process |
| 2017 | 472 | 0% | estimation process |
| 2018 | 471 | -0.21% | estimation process |
| 2019 | 471 | 0% | estimation process |
| 2020 | 478 | 1.46% | estimation process |
Demographic Facts
| Estimated population as of July 1, 2019 : | 72,689 |
| Based on demographic estimates as of April 1, 2010 : | 71,715 |
| Based on demographic estimates as of 1 April 2010 : | 1.4% |
| April 1, 2020 Population : | 76,618 |
| April 1, 2010 Population : | 71,739 |
| People under 5 years old, percentage : | 4.3% |
| People under 18 years old, percentage : | 18.4% |
| People over 65 (%) : | 20.4% |
| Female persons, % : | 54.8% |
| White only, percent : | 23.1% |
| Black or African American alone, percent : | 69.4% |
| American Indian and Alaska Native only, % : | 0.1% |
| Asians alone % : | 2.3% |
| Only Native Hawaiians and Other Pacific Islanders, % : | 0.0% |
| % of people who have participated in two or more races : | 4.0% |
| % of Hispanic or Latino : | 1.8% |
| White people, not Hispanic or Latino people, make up the majority of the population. : | 22.4% |
| 2015-2019 Veterans : | 4,004 |
| Percentage of foreign-born people, 2015-2019 : | 7.6% |
| Rate of owner-occupied housing units, 2015-2019 : | 47.8% |
Economic Facts
| Rate of owner-occupied housing units, 2015-2019 : | 47.8% |
| Owner-occupied housing unit median value, 2015-2019 : | $155,700 |
| From 2015 to 2019, the median selected monthly owner costs - with a mortgage : | $1,475 |
| Monthly owner costs, without a mortgage, at the median, 2015-2019 : | $654 |
| 2015-2019 median gross rent : | $1,125 |
| 2015-2019 Households : | 32,345 |
| Population per household, 2015-2019 : | 2.22 |
| Living in the same house a year ago, percentage of people aged one year and up, 2015-2019 : | 84.7% |
| Languages other than English spoken at home, as a percentage of people aged 5 and up, 2015-2019 : | 9.4% |
| Households with computers, %, 2015-2019 : | 89.5% |
| Percentage of households with a broadband Internet subscription, 2015-2019 : | 83.5% |
| Percentage of people aged 25 and up with a high school diploma or higher, 2015-2019 : | 92.2% |
| Bachelor's degree or higher, proportion of people aged 25 and up, 2015-2019 : | 37.7% |
| Percentage of people under the age of 65 who have a disability, 2015-2019 : | 12.9% |
| Persons under the age of 65 who do not have health insurance, as a percentage : | 6.5% |
| Total civilian labor force, percent of population aged 16 and up, 2015-2019 : | 61.0% |
| Female labor force participation in the civilian labor force, as a percentage of the population aged 16 and up, 2015-2019 : | 58.5% |
| Total sales of lodging and food services in 2012 ($1,000) : | 234,825 |
| Total receipts/revenue for health care and social assistance in 2012 ($1,000) : | 1,547,245 |
| 2012 total retail sales ($1,000) : | 2,009,704 |
| 2012 total retail sales per capita : | $27,717 |
| Mean commute time to work (in minutes), workers aged 16 and up, 2015-2019 : | 24.0 |
| 2015-2019 median household income (in 2019 dollars) : | $55,705 |
| Income per capita in the previous 12 months (in 2019 dollars), 2015-2019 : | $33,104 |
| Percentage of people living in poverty : | 11.3% |
| Total number of businesses in 2012 : | 10,720 |
| Men-owned businesses in 2012 : | 5,244 |
| Women-owned businesses in 2012 : | 4,041 |
| Minority-owned businesses in 2012 : | 5,305 |
| Non-minority-owned businesses in 2012 : | 4,675 |
| Veteran-owned businesses in 2012 : | 930 |
| Nonveteran-owned businesses in 2012 : | 9,008 |
| 2010 population per square mile : | 2,730.5 |
| 2010 land area in square miles : | 26.27 |
Best Things to Do in Mackinac Island
1Mackinac Island State Park
7029 Huron Rd, Mackinac Island, MI 49757, United States View details
Phone: +19068473328 | Website available
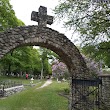
2Arch Rock
6131 Arch Rock Rd, Mackinac Island, MI 49757, United States View details
Phone: +19068473328 | Website available

3The Original Mackinac Island Butterfly House and Insect World
6750 McGulpin St, Mackinac Island, MI 49757, United States View details
Phone: +19068473972 | Website available

4Fort Holmes
2234 Fort Holmes Rd, Mackinac Island, MI 49757, United States View details
Phone: +19068473328 | Website available
5Marquette Park
7200 Huron St, Mackinac Island, MI 49757, United States View details
Website available
Nearby Transit Stations (10)
Rail and bus stations connected to Mackinac Island, MI. Select a station to open its map and address details.
| Code | Name | Address | Type |
|---|---|---|---|
| STI | St. Ignace, Michigan | 448 North State St. | BUS |
| MAK | Mackinaw City, Michigan | 102 South Huron Ave. | BUS |
| CHB | Cheboygan, MI | 309 East State Street | BUS |
| PST | Pellston, Michigan | 110 North US Highway 131 | BUS |
| ALA | Alanson, MI | 7640 Burr Avenue | BUS |
Closest post offices linked to Mackinac Island.
| Post Office Name | City | ZIP |
|---|---|---|
| Mackinac Island Post Office | Mackinac Island (MI) | 49757 |
Other cities in Mackinac County
Cities, towns, neighborhoods & other populated places in Mackinac County , MI.
| City Name | Population | Title |
|---|---|---|
| Pickford | 1,553 | Township of Michigan |
| Curtis | 1,193 | Unincorporated community in Portage Township, Mackinac County, Michigan, USA |
| Moran | 981 | Township in Mackinac County, Michigan |
| Saint Ignace | 903 | City in Michigan, USA |
| Brevort | 571 | Township in Mackinac County, Michigan |
| Cedarville | 242 | Township in Mackinac County, Michigan |