Loami, Illinois
Loami: township in Sangamon County, Illinois
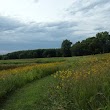
About
Loami is a township located in the county of Sangamon in the U.S. state of Illinois. Its population at the 2010 census was 745 and a population density of 35 people per km². After 10 years in 2020 city had an estimated population of 751 inhabitants.

Quick Facts about Loami
| Population | 751 (2020) |
| Country | United States of America |
| State | Illinois (United States) |
| County | Sangamon County |
| Area | 21.16 km2 |
| Latitude & Longitude | 39.6756,-89.8468 |
| Time Zone | America/Chicago |
| Local time | 02:57:29 (18th July 2026) |
| Postal code | 62661 |
| Density | 35 Pop. per km² as of 2020 |
| Population growth | 0.8% (2010-2020) |
| Weather | 91℉ Sunny then Chance Showers And Thunderstorms 7-days weather |
Geography
Loami is located at 39°40'32"N 89°50'48"W (39.6756100, -89.8467700).
Loami map
Weather
A chance of showers and thunderstorms after 3pm. Sunny, with a high near 91. Heat index values as high as 102. West wind 8 to 13 mph, with gusts as hi...
7-Day ForecastDemographics
The population of Loami increased by 0.8% in 10 years.
| Year | Population | % Change | Method |
|---|---|---|---|
| 2010 | 745 | - | census |
| 2011 | 757 | 1.59% | estimation process |
| 2012 | 761 | 0.53% | estimation process |
| 2013 | 763 | 0.26% | estimation process |
| 2014 | 766 | 0.39% | estimation process |
| 2015 | 767 | 0.13% | estimation process |
| 2016 | 768 | 0.13% | estimation process |
| 2017 | 766 | -0.26% | estimation process |
| 2018 | 761 | -0.66% | estimation process |
| 2019 | 757 | -0.53% | estimation process |
| 2020 | 751 | -0.8% | estimation process |
Demographic Facts
| Estimated population as of July 1, 2019 : | 44,079 |
| Based on demographic estimates as of April 1, 2010 : | 42,588 |
| Based on demographic estimates as of 1 April 2010 : | 3.5% |
| April 1, 2020 Population : | 44,322 |
| April 1, 2010 Population : | 42,598 |
| People under 5 years old, percentage : | 8.4% |
| People under 18 years old, percentage : | 29.4% |
| People over 65 (%) : | 13.3% |
| Female persons, % : | 50.5% |
| White only, percent : | 41.8% |
| Black or African American alone, percent : | 2.2% |
| American Indian and Alaska Native only, % : | 0.8% |
| Asians alone % : | 2.4% |
| Only Native Hawaiians and Other Pacific Islanders, % : | 0.2% |
| % of people who have participated in two or more races : | 4.9% |
| % of Hispanic or Latino : | 87.0% |
| White people, not Hispanic or Latino people, make up the majority of the population. : | 8.3% |
| 2015-2019 Veterans : | 1,299 |
| Percentage of foreign-born people, 2015-2019 : | 31.1% |
| Rate of owner-occupied housing units, 2015-2019 : | 50.8% |
Economic Facts
| Rate of owner-occupied housing units, 2015-2019 : | 50.8% |
| Owner-occupied housing unit median value, 2015-2019 : | $192,600 |
| From 2015 to 2019, the median selected monthly owner costs - with a mortgage : | $1,533 |
| Monthly owner costs, without a mortgage, at the median, 2015-2019 : | $509 |
| 2015-2019 median gross rent : | $803 |
| 2015-2019 Households : | 11,625 |
| Population per household, 2015-2019 : | 3.74 |
| Living in the same house a year ago, percentage of people aged one year and up, 2015-2019 : | 86.7% |
| Languages other than English spoken at home, as a percentage of people aged 5 and up, 2015-2019 : | 79.8% |
| Households with computers, %, 2015-2019 : | 87.3% |
| Percentage of households with a broadband Internet subscription, 2015-2019 : | 81.5% |
| Percentage of people aged 25 and up with a high school diploma or higher, 2015-2019 : | 69.9% |
| Bachelor's degree or higher, proportion of people aged 25 and up, 2015-2019 : | 17.8% |
| Percentage of people under the age of 65 who have a disability, 2015-2019 : | 11.0% |
| Persons under the age of 65 who do not have health insurance, as a percentage : | 8.4% |
| Total civilian labor force, percent of population aged 16 and up, 2015-2019 : | 55.8% |
| Female labor force participation in the civilian labor force, as a percentage of the population aged 16 and up, 2015-2019 : | 50.2% |
| Total sales of lodging and food services in 2012 ($1,000) : | 97,132 |
| Total receipts/revenue for health care and social assistance in 2012 ($1,000) : | 261,142 |
| 2012 total retail sales ($1,000) : | 925,903 |
| 2012 total retail sales per capita : | $21,479 |
| Mean commute time to work (in minutes), workers aged 16 and up, 2015-2019 : | 18.0 |
| 2015-2019 median household income (in 2019 dollars) : | $47,864 |
| Income per capita in the previous 12 months (in 2019 dollars), 2015-2019 : | $19,465 |
| Percentage of people living in poverty : | 24.8% |
| Total number of businesses in 2012 : | 2,942 |
| Men-owned businesses in 2012 : | 1,338 |
| Women-owned businesses in 2012 : | 1,235 |
| Minority-owned businesses in 2012 : | 2,017 |
| Non-minority-owned businesses in 2012 : | 745 |
| Veteran-owned businesses in 2012 : | 226 |
| Nonveteran-owned businesses in 2012 : | 2,443 |
| 2010 population per square mile : | 3,844.2 |
| 2010 land area in square miles : | 11.08 |
Best Things to Do in Loami
1Nipper Wildlife Sanctuary
9873, 9399 Withers Rd, Loami, IL 62661, United States View details
Website available
Nearby Schools and Colleges
Schools and campuses linked to Loami, IL. Select a name to open its map and contact details.
| Code | Name | City | ZIP |
|---|---|---|---|
| 149550 | University of Spa & Cosmetology Arts | Springfield (IL) | 62704 |
Nearby Transit Stations (7)
Rail and bus stations connected to Loami, IL. Select a station to open its map and address details.
| Code | Name | Address | Type |
|---|---|---|---|
| SPI | Springfield station | East Washington and North Third Sts. | RAIL |
| CRV | Carlinville | 128 Alton Rd. | RAIL |
| LCN | Lincoln | Broadway and North Chicago Sts. | RAIL |
| ALN | Alton | 3400 College Ave. | RAIL |
| PIA | Peoria, Illinois | 6100 West Everett M. Dirksen Parkway | BUS |
Closest post offices linked to Loami.
| Post Office Name | City | ZIP |
|---|---|---|
| Loam Post Office | Loami (IL) | 62661 |
Other cities in Sangamon County
Cities, towns, neighborhoods & other populated places in Sangamon County , IL. (more)
| City Name | Population | Title |
|---|---|---|
| Springfield | 113,671 | The capital of Illinois and the county seat of Sangamon County. |
| Chatham | 13,159 | Village in Illinois, USA |
| Woodside | 10,484 | Township in Sangamon County, Illinois |
| Sherman | 4,660 | Village in Illinois, USA |
| Auburn | 4,591 | City in Sangamon County, Illinois, United States |
| Rochester | 3,715 | Village in Sangamon County, Illinois, United States |
| Riverton | 3,430 | Village in Illinois |
| Pawnee | 2,646 | City in Oklahoma |
| Buckhart | 1,679 | Unincorporated community in Illinois |
| Jerome | 1,575 | Village in Illinois, United States |
| Southern View | 1,557 | City in Sangamon County, Illinois, United States of America |
| Williamsville | 1,490 | Village in the United States |
| Leland Grove | 1,451 | City in Sangamon County, Illinois, United States |
| Grandview | 1,369 | City in Sangamon County, Illinois, United States of America |
| New Berlin | 1,329 | Township in Sangamon County, Illinois |
| Divernon | 1,096 | City in Illinois, United States of America |