Lebanon, New Hampshire
Lebanon: city in Grafton County, New Hampshire, United States
About
Lebanon is a city located in the county of Grafton in the U.S. state of New Hampshire. Its population at the 2010 census was 13,151. After 10 years in 2020 city had an estimated population of 13,808 inhabitants.
The city was created 265 years ago in 1760.

Quick Facts about Lebanon
| Population | 13,808 (2020) |
| Country | United States of America |
| State | New Hampshire (United States) |
| County | Grafton County |
| Different from | Lebanon |
| Phone Area Codes | 603 |
| Water as percent of area | 2.45% |
| Land as percent of area | 97.55% |
| Latitude & Longitude | 43.6423,-72.2518 |
| Altitude | 581 feet / 177 meters |
| Establishment | January 01, 1761 (265 years ago) |
| Time Zone | Eastern Time Zone |
| Local time | 05:34:17 (22nd June 2026) |
| Postal code | 03766 |
| Population growth | 4.76% (2010-2020) |
| Weather | 53℉ Areas Of Fog 7-days weather |

Geography
Lebanon is located at 43°38'32"N 72°15'6"W (43.6422900, -72.2517600).
Lebanon map
Weather
Areas of fog after 1am. Mostly cloudy, with a low around 53. West wind around 0 mph.
7-Day ForecastOfficial website of Lebanon
Official WebsiteDemographics
The population of Lebanon increased by 4.76% in 10 years.
| Year | Population | % Change | Method |
|---|---|---|---|
| 2010 | 13,151 | - | census |
| 2011 | 13,491 | 2.52% | estimation process |
| 2012 | 13,540 | 0.36% | estimation process |
| 2013 | 13,645 | 0.77% | estimation process |
| 2014 | 13,611 | -0.25% | estimation process |
| 2015 | 13,641 | 0.22% | estimation process |
| 2016 | 13,623 | -0.13% | estimation process |
| 2017 | 13,605 | -0.13% | estimation process |
| 2018 | 13,584 | -0.15% | estimation process |
| 2019 | 13,651 | 0.49% | estimation process |
| 2020 | 13,808 | 1.14% | estimation process |
Demographic Facts
| Estimated population as of July 1, 2019 : | 10,126 |
| Based on demographic estimates as of April 1, 2010 : | 9,047 |
| Based on demographic estimates as of 1 April 2010 : | 11.9% |
| April 1, 2020 Population : | 10,559 |
| April 1, 2010 Population : | 9,001 |
| People under 5 years old, percentage : | 5.3% |
| People under 18 years old, percentage : | 25.6% |
| People over 65 (%) : | 12.9% |
| Female persons, % : | 53.9% |
| White only, percent : | 89.8% |
| Black or African American alone, percent : | 5.9% |
| American Indian and Alaska Native only, % : | 0.0% |
| Asians alone % : | 4.0% |
| Only Native Hawaiians and Other Pacific Islanders, % : | 0.0% |
| % of people who have participated in two or more races : | 0.3% |
| % of Hispanic or Latino : | 2.2% |
| White people, not Hispanic or Latino people, make up the majority of the population. : | 87.5% |
| 2015-2019 Veterans : | 612 |
| Percentage of foreign-born people, 2015-2019 : | 3.0% |
| Rate of owner-occupied housing units, 2015-2019 : | 65.1% |
Economic Facts
| Rate of owner-occupied housing units, 2015-2019 : | 65.1% |
| Owner-occupied housing unit median value, 2015-2019 : | $161,900 |
| From 2015 to 2019, the median selected monthly owner costs - with a mortgage : | $1,317 |
| Monthly owner costs, without a mortgage, at the median, 2015-2019 : | $517 |
| 2015-2019 median gross rent : | $865 |
| 2015-2019 Households : | 3,542 |
| Population per household, 2015-2019 : | 2.78 |
| Living in the same house a year ago, percentage of people aged one year and up, 2015-2019 : | 81.3% |
| Languages other than English spoken at home, as a percentage of people aged 5 and up, 2015-2019 : | 4.4% |
| Households with computers, %, 2015-2019 : | 92.8% |
| Percentage of households with a broadband Internet subscription, 2015-2019 : | 85.0% |
| Percentage of people aged 25 and up with a high school diploma or higher, 2015-2019 : | 89.9% |
| Bachelor's degree or higher, proportion of people aged 25 and up, 2015-2019 : | 29.7% |
| Percentage of people under the age of 65 who have a disability, 2015-2019 : | 7.9% |
| Persons under the age of 65 who do not have health insurance, as a percentage : | 5.9% |
| Total civilian labor force, percent of population aged 16 and up, 2015-2019 : | 71.1% |
| Female labor force participation in the civilian labor force, as a percentage of the population aged 16 and up, 2015-2019 : | 67.5% |
| Total sales of lodging and food services in 2012 ($1,000) : | 12,092 |
| Total receipts/revenue for health care and social assistance in 2012 ($1,000) : | 277,780 |
| 2012 total retail sales ($1,000) : | 134,399 |
| 2012 total retail sales per capita : | $14,727 |
| Mean commute time to work (in minutes), workers aged 16 and up, 2015-2019 : | 23.7 |
| 2015-2019 median household income (in 2019 dollars) : | $77,806 |
| Income per capita in the previous 12 months (in 2019 dollars), 2015-2019 : | $32,311 |
| Percentage of people living in poverty : | 7.1% |
| Total number of businesses in 2012 : | 711 |
| Men-owned businesses in 2012 : | 422 |
| Women-owned businesses in 2012 : | 208 |
| Minority-owned businesses in 2012 : | 28 |
| Non-minority-owned businesses in 2012 : | 638 |
| Veteran-owned businesses in 2012 : | 46 |
| Nonveteran-owned businesses in 2012 : | 619 |
| 2010 population per square mile : | 1,298.8 |
| 2010 land area in square miles : | 6.93 |
| Rate of owner-occupied housing units, 2015-2019 : | 84.2% |
| Owner-occupied housing unit median value, 2015-2019 : | $259,300 |
| From 2015 to 2019, the median selected monthly owner costs - with a mortgage : | $1,730 |
| Monthly owner costs, without a mortgage, at the median, 2015-2019 : | $535 |
| 2015-2019 median gross rent : | $1,500 |
| 2015-2019 Households : | 5,512 |
| Population per household, 2015-2019 : | 2.67 |
| Living in the same house a year ago, percentage of people aged one year and up, 2015-2019 : | 88.2% |
| Languages other than English spoken at home, as a percentage of people aged 5 and up, 2015-2019 : | 2.8% |
| Households with computers, %, 2015-2019 : | 96.0% |
| Percentage of households with a broadband Internet subscription, 2015-2019 : | 92.1% |
| Percentage of people aged 25 and up with a high school diploma or higher, 2015-2019 : | 97.6% |
| Bachelor's degree or higher, proportion of people aged 25 and up, 2015-2019 : | 37.5% |
| Percentage of people under the age of 65 who have a disability, 2015-2019 : | 5.1% |
| Persons under the age of 65 who do not have health insurance, as a percentage : | 1.6% |
| Total civilian labor force, percent of population aged 16 and up, 2015-2019 : | 75.1% |
| Female labor force participation in the civilian labor force, as a percentage of the population aged 16 and up, 2015-2019 : | 72.9% |
| Total sales of lodging and food services in 2012 ($1,000) : | 7,983 |
| Total receipts/revenue for health care and social assistance in 2012 ($1,000) : | 14,745 |
| 2012 total retail sales ($1,000) : | 58,018 |
| 2012 total retail sales per capita : | $4,194 |
| Mean commute time to work (in minutes), workers aged 16 and up, 2015-2019 : | 27.8 |
| 2015-2019 median household income (in 2019 dollars) : | $89,969 |
| Income per capita in the previous 12 months (in 2019 dollars), 2015-2019 : | $42,399 |
| Percentage of people living in poverty : | 2.6% |
| Total number of businesses in 2012 : | 1,036 |
| Men-owned businesses in 2012 : | 691 |
| Women-owned businesses in 2012 : | 330 |
| Minority-owned businesses in 2012 : | 74 |
| Non-minority-owned businesses in 2012 : | 953 |
| Veteran-owned businesses in 2012 : | 138 |
| Nonveteran-owned businesses in 2012 : | 861 |
| 2010 population per square mile : | 398.6 |
| 2010 land area in square miles : | 33.45 |
| Residential units, July 1, 2019 : | 16,972 |
| Rate of owner-occupied housing units, 2015-2019 : | 61.5% |
| Owner-occupied housing unit median value, 2015-2019 : | $103,800 |
| From 2015 to 2019, the median selected monthly owner costs - with a mortgage : | $1,017 |
| Monthly owner costs, without a mortgage, at the median, 2015-2019 : | $359 |
| 2015-2019 median gross rent : | $680 |
| Permits for construction, 2020 : | 66 |
| 2015-2019 Households : | 15,120 |
| Population per household, 2015-2019 : | 2.44 |
| Living in the same house a year ago, percentage of people aged one year and up, 2015-2019 : | 84.3% |
| Languages other than English spoken at home, as a percentage of people aged 5 and up, 2015-2019 : | 3.4% |
| Households with computers, %, 2015-2019 : | 83.6% |
| Percentage of households with a broadband Internet subscription, 2015-2019 : | 76.5% |
| Percentage of people aged 25 and up with a high school diploma or higher, 2015-2019 : | 83.9% |
| Bachelor's degree or higher, proportion of people aged 25 and up, 2015-2019 : | 16.1% |
| Percentage of people under the age of 65 who have a disability, 2015-2019 : | 14.8% |
| Persons under the age of 65 who do not have health insurance, as a percentage : | 11.5% |
| Total civilian labor force, percent of population aged 16 and up, 2015-2019 : | 58.8% |
| Female labor force participation in the civilian labor force, as a percentage of the population aged 16 and up, 2015-2019 : | 54.2% |
| Total sales of lodging and food services in 2012 ($1,000) : | 42,441 |
| Total receipts/revenue for health care and social assistance in 2012 ($1,000) : | 200,584 |
| Manufacturers' total shipments in 2012 ($1,000) : | 1,455,595 |
| 2012 total retail sales ($1,000) : | 580,848 |
| 2012 total retail sales per capita : | $15,184 |
| Mean commute time to work (in minutes), workers aged 16 and up, 2015-2019 : | 20.4 |
| 2015-2019 median household income (in 2019 dollars) : | $44,185 |
| Income per capita in the previous 12 months (in 2019 dollars), 2015-2019 : | $27,710 |
| Percentage of people living in poverty : | 17.3% |
| Total number of employer establishments, 2019 : | 786 |
| 2019 total employment : | 12,975 |
| 2019 total annual payroll ($1,000) : | 489,550 |
| Total employment, change in percentage terms, 2018-2019 : | 1.5% |
| 2018 total non-employer establishments : | 2,454 |
| Total number of businesses in 2012 : | 3,530 |
| Men-owned businesses in 2012 : | 1,770 |
| Women-owned businesses in 2012 : | 1,304 |
| Minority-owned businesses in 2012 : | 525 |
| Non-minority-owned businesses in 2012 : | 2,872 |
| Veteran-owned businesses in 2012 : | 280 |
| Nonveteran-owned businesses in 2012 : | 3,037 |
| 2010 population per square mile : | 74.8 |
| 2010 land area in square miles : | 512.33 |
| Rate of owner-occupied housing units, 2015-2019 : | 79.4% |
| Owner-occupied housing unit median value, 2015-2019 : | $184,200 |
| From 2015 to 2019, the median selected monthly owner costs - with a mortgage : | $1,548 |
| Monthly owner costs, without a mortgage, at the median, 2015-2019 : | $532 |
| 2015-2019 median gross rent : | $1,104 |
| 2015-2019 Households : | 1,701 |
| Population per household, 2015-2019 : | 2.83 |
| Living in the same house a year ago, percentage of people aged one year and up, 2015-2019 : | 85.7% |
| Languages other than English spoken at home, as a percentage of people aged 5 and up, 2015-2019 : | 12.7% |
| Households with computers, %, 2015-2019 : | 97.0% |
| Percentage of households with a broadband Internet subscription, 2015-2019 : | 95.6% |
| Percentage of people aged 25 and up with a high school diploma or higher, 2015-2019 : | 91.9% |
| Bachelor's degree or higher, proportion of people aged 25 and up, 2015-2019 : | 31.2% |
| Percentage of people under the age of 65 who have a disability, 2015-2019 : | 5.1% |
| Persons under the age of 65 who do not have health insurance, as a percentage : | 16.4% |
| Total civilian labor force, percent of population aged 16 and up, 2015-2019 : | 79.7% |
| Female labor force participation in the civilian labor force, as a percentage of the population aged 16 and up, 2015-2019 : | 75.2% |
| Total sales of lodging and food services in 2012 ($1,000) : | 7,628 |
| Total receipts/revenue for health care and social assistance in 2012 ($1,000) : | 2,274 |
| 2012 total retail sales ($1,000) : | 14,495 |
| 2012 total retail sales per capita : | $3,706 |
| Mean commute time to work (in minutes), workers aged 16 and up, 2015-2019 : | 18.0 |
| 2015-2019 median household income (in 2019 dollars) : | $81,636 |
| Income per capita in the previous 12 months (in 2019 dollars), 2015-2019 : | $32,957 |
| Percentage of people living in poverty : | 7.8% |
| Total number of businesses in 2012 : | 510 |
| Men-owned businesses in 2012 : | 314 |
| Women-owned businesses in 2012 : | 141 |
| Minority-owned businesses in 2012 : | F |
| Non-minority-owned businesses in 2012 : | 479 |
| Veteran-owned businesses in 2012 : | F |
| Nonveteran-owned businesses in 2012 : | 487 |
| 2010 population per square mile : | 1,195.0 |
| 2010 land area in square miles : | 3.07 |
| Rate of owner-occupied housing units, 2015-2019 : | 90.6% |
| Owner-occupied housing unit median value, 2015-2019 : | $216,200 |
| From 2015 to 2019, the median selected monthly owner costs - with a mortgage : | $1,653 |
| Monthly owner costs, without a mortgage, at the median, 2015-2019 : | $760 |
| 2015-2019 median gross rent : | $1,393 |
| 2015-2019 Households : | 3,191 |
| Population per household, 2015-2019 : | 2.74 |
| Living in the same house a year ago, percentage of people aged one year and up, 2015-2019 : | 78.3% |
| Languages other than English spoken at home, as a percentage of people aged 5 and up, 2015-2019 : | 8.8% |
| Households with computers, %, 2015-2019 : | 94.2% |
| Percentage of households with a broadband Internet subscription, 2015-2019 : | 91.7% |
| Percentage of people aged 25 and up with a high school diploma or higher, 2015-2019 : | 94.7% |
| Bachelor's degree or higher, proportion of people aged 25 and up, 2015-2019 : | 52.8% |
| Percentage of people under the age of 65 who have a disability, 2015-2019 : | 10.1% |
| Persons under the age of 65 who do not have health insurance, as a percentage : | 6.9% |
| Total civilian labor force, percent of population aged 16 and up, 2015-2019 : | 56.8% |
| Female labor force participation in the civilian labor force, as a percentage of the population aged 16 and up, 2015-2019 : | 47.2% |
| Total receipts/revenue for health care and social assistance in 2012 ($1,000) : | 27,669 |
| Manufacturers' total shipments in 2012 ($1,000) : | 139,754 |
| 2012 total retail sales ($1,000) : | 52,836 |
| 2012 total retail sales per capita : | $6,150 |
| Mean commute time to work (in minutes), workers aged 16 and up, 2015-2019 : | 15.7 |
| 2015-2019 median household income (in 2019 dollars) : | $89,196 |
| Income per capita in the previous 12 months (in 2019 dollars), 2015-2019 : | $40,830 |
| Percentage of people living in poverty : | 3.9% |
| Total number of businesses in 2012 : | 777 |
| Men-owned businesses in 2012 : | 315 |
| Women-owned businesses in 2012 : | 383 |
| Minority-owned businesses in 2012 : | 122 |
| Non-minority-owned businesses in 2012 : | 614 |
| Veteran-owned businesses in 2012 : | 46 |
| Nonveteran-owned businesses in 2012 : | 663 |
| 2010 population per square mile : | 1,292.9 |
| 2010 land area in square miles : | 6.54 |
Best Things to Do in Lebanon
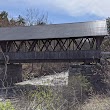
1Packard Hill Covered Bridge
Riverside Dr, Lebanon, NH 03766, United States View details
Website available
Services and Civic Places in Lebanon
1City of Lebanon
51 N Park St, Lebanon, NH 03766 View details
Phone: +16034484220 | Website available

People born in Lebanon (26)
People born in Lebanon, including Australian professional golfer Aaron Baddeley, politician Thomas Whipple, Jr., minister George Storrs, .
More notable people
- Experience Estabrook (American politician (1813-1894)) he was born in 30/04/1813
- Phineas Quimby (American writer) he was born in 16/02/1802
- Rebekah Driscoll (American composer) she was born in 01/01/1980
- Stacey Wooley (American biathlete) she was born in 21/04/1968
- Mia Tyler (American model and actress) she was born in 22/12/1978
- George Halsey Perley (Canadian politician) he was born in 12/09/1857
- Ammi B. Young (American architect) he was born in 19/06/1798
- Dave Cole (sculptor) he was born in 01/01/1975
- Duane R. Bushey (Master Chief Petty Officer of the Navy) he was born in 03/05/1944
- Rob Woodward (American baseball player) he was born in 28/09/1962
- William Ticknor (American publisher (1810-1864)) he was born in 06/08/1810
- Tara Geraghty-Moats (American ski jumper) she was born in 12/04/1993
- Stephen Bliss (American preacher) he was born in 27/03/1787
- Elisha P. Jewett (Vermont businessman, banker and politician) he was born in 05/06/1801
- Andy Sanborn (American politician)
- Peter D. Gerakaris he was born in 01/01/1981
- Ralph Townsend (Nordic combined- and cross-country skier for the US) he was born in 28/12/1921
- Scott H. Stalker (American governmental official) he was born in 01/01/1975
Nearby Schools and Colleges
Schools and campuses linked to Lebanon, NH. Select a name to open its map and contact details.
| Code | Name | City | ZIP |
|---|---|---|---|
| 440004 | Upper Valley Educators Institute | Lebanon (NH) | 03766-1358 |
Nearby Transit Stations (28)
Rail and bus stations connected to Lebanon, NH. Select a station to open its map and address details.
| Code | Name | Address | Type |
|---|---|---|---|
| WRJ | White River Junction | 102 Railroad Row | RAIL |
| WNM | Windsor station | 26 Depot Ave | RAIL |
| CLA | Claremont | Plains Rd. and Maple Ave. | RAIL |
| RPH | Randolph station | South Main and Salisbury Sts. | RAIL |
| OKO | Okemo, Vermont | 77 Okemo Ridge Rd | BUS |
Closest post offices linked to Lebanon.
| Post Office Name | City | ZIP |
|---|---|---|
| Lebanon Post Office | Lebanon (NH) | 03766 |
Other places with the same name (18)
- Lebanon, Tennessee city in Wilson County, Tennessee, United States with a population of 38,086 people.
- Lebanon, Tennessee city in Wilson County, Tennessee, United States with a population of 30,262 people.
- Lebanon, Ohio city in southwestern Ohio, United States with a population of 20,761 people.
- Lebanon, Oregon city in Oregon, USA with a population of 17,562 people.
- Lebanon, Indiana city in Indiana, United States with a population of 16,120 people.
- Lebanon, Missouri city in Laclede County, Missouri, United States with a population of 14,881 people.
- Lebanon, Connecticut town in New London County, Connecticut, United States with a population of 7,112 people.
- Lebanon, Maine town in Maine with a population of 6,435 people.
- Lebanon, Kentucky city in Marion County, Kentucky, United States with a population of 5,733 people.
- Lebanon, Illinois city in St. with a population of 4,225 people.
- Lebanon, Virginia town in Russell County, Virginia, United States with a population of 3,184 people.
- Lebanon, New Jersey township in Hunterdon County, New Jersey, United States with a population of 1,638 people.
- Lebanon, Wisconsin city in Dodge County, Wisconsin, United States of America with a population of 1,636 people.
- Lebanon, New York town in New York, United States with a population of 1,294 people.
- Lebanon, Pennsylvania Independent country in Western Asia with a population of 671 people.
- Lebanon, Kansas city in Smith County, Kansas, United States with a population of 195 people.
- Lebanon, Nebraska town in Nebraska, United States with a population of 76 people.
- Lebanon, South Dakota town in South Dakota, United States of America with a population of 43 people.
Other cities in Grafton County
Cities, towns, neighborhoods & other populated places in Grafton County , NH. (more)
| City Name | Population | Title |
|---|---|---|
| Hanover | 11,555 | Town in Grafton County, New Hampshire, United States |
| Plymouth | 6,916 | Town in New Hampshire |
| Littleton | 5,902 | Town in New Hampshire, United States |
| Enfield | 4,564 | Town in Grafton County, New Hampshire, United States |
| Haverhill | 4,555 | Town in New Hampshire, United States |
| Canaan | 3,917 | Town in New Hamsphire |
| Bristol | 3,156 | Town in New Hampshire |
| Bethlehem | 2,656 | Town in New Hampshire |
| Thornton | 2,553 | Town in Grafton County, New Hampshire, United States |
| Holderness | 2,131 | Town in Grafton County, New Hampshire |
| Ashland | 2,067 | Town in New Hampshire |
| Lincoln | 1,775 | Town in New Hampshire, United States |
| Lyme | 1,685 | Town in New London County, Connecticut, United States |
| Alexandria | 1,628 | Town in Grafton County, New Hampshire |
| Lisbon | 1,587 | Town in New Hampshire, USA |
| Rumney | 1,575 | City in Grafton County, New Hampshire, United States of America |
Distance to Other Cities
Lebanon distances to largest New Hampshire cities