Jasper, Indiana
Jasper: city in Dubois County, Indiana, United States
About
Jasper is a city located in the county of Dubois in the U.S. state of Indiana. Its population at the 2010 census was 15,038 and a population density of 435 people per km². After 10 years in 2020 city had an estimated population of 15,667 inhabitants.
The city was created 208 years ago in 1817.

Quick Facts about Jasper
| Population | 15,667 (2020) |
| Country | United States of America |
| State | Indiana (United States) |
| County | Dubois County |
| Different from | Jasper County |
| Phone Area Codes | 812 |
| Area | 34.57 km2 |
| Latitude & Longitude | 38.3914,-86.9311 |
| Altitude | 466 feet / 142 meters |
| Capital city | Jasper is capital of Dubois County |
| Establishment | January 01, 1818 (208 years ago) |
| Time Zone | Eastern Time Zone |
| Local time | 15:59:28 (1st August 2026) |
| Postal code | 47546 |
| Density | 453 Pop. per km² as of 2020 |
| Population growth | 4.01% (2010-2020) |
| Weather | 81℉ Showers And Thunderstorms 7-days weather |

Geography
Jasper is located at 38°23'29"N 86°55'52"W (38.3914400, -86.9311100).
Jasper map
Weather
Showers and thunderstorms before 5pm, then a chance of showers and thunderstorms. Mostly cloudy, with a high near 81. South wind around 10 mph. Chance...
7-Day ForecastOfficial website of Jasper
Official WebsiteDemographics
The population of Jasper increased by 4.01% in 10 years.
| Year | Population | % Change | Method |
|---|---|---|---|
| 2010 | 15,038 | - | census |
| 2011 | 15,251 | 1.4% | estimation process |
| 2012 | 15,242 | -0.06% | estimation process |
| 2013 | 15,320 | 0.51% | estimation process |
| 2014 | 15,365 | 0.29% | estimation process |
| 2015 | 15,439 | 0.48% | estimation process |
| 2016 | 15,494 | 0.35% | estimation process |
| 2017 | 15,575 | 0.52% | estimation process |
| 2018 | 15,658 | 0.53% | estimation process |
| 2019 | 15,724 | 0.42% | estimation process |
| 2020 | 15,667 | -0.36% | estimation process |
Demographic Facts
| Estimated population as of July 1, 2019 : | 13,178 |
| Based on demographic estimates as of April 1, 2010 : | 13,580 |
| Based on demographic estimates as of 1 April 2010 : | -3.0% |
| April 1, 2020 Population : | 13,475 |
| April 1, 2010 Population : | 13,579 |
| People under 5 years old, percentage : | 6.2% |
| People under 18 years old, percentage : | 26.2% |
| People over 65 (%) : | 18.4% |
| Female persons, % : | 53.5% |
| White only, percent : | 89.8% |
| Black or African American alone, percent : | 3.7% |
| American Indian and Alaska Native only, % : | 0.0% |
| Asians alone % : | 2.0% |
| Only Native Hawaiians and Other Pacific Islanders, % : | 0.0% |
| % of people who have participated in two or more races : | 1.8% |
| % of Hispanic or Latino : | 10.4% |
| White people, not Hispanic or Latino people, make up the majority of the population. : | 82.9% |
| 2015-2019 Veterans : | 674 |
| Percentage of foreign-born people, 2015-2019 : | 7.8% |
| Rate of owner-occupied housing units, 2015-2019 : | 72.3% |
Economic Facts
| Rate of owner-occupied housing units, 2015-2019 : | 72.3% |
| Owner-occupied housing unit median value, 2015-2019 : | $361,500 |
| From 2015 to 2019, the median selected monthly owner costs - with a mortgage : | $2,457 |
| Monthly owner costs, without a mortgage, at the median, 2015-2019 : | $839 |
| 2015-2019 median gross rent : | $1,172 |
| 2015-2019 Households : | 5,028 |
| Population per household, 2015-2019 : | 2.62 |
| Living in the same house a year ago, percentage of people aged one year and up, 2015-2019 : | 89.3% |
| Languages other than English spoken at home, as a percentage of people aged 5 and up, 2015-2019 : | 14.1% |
| Households with computers, %, 2015-2019 : | 90.2% |
| Percentage of households with a broadband Internet subscription, 2015-2019 : | 85.2% |
| Percentage of people aged 25 and up with a high school diploma or higher, 2015-2019 : | 95.3% |
| Bachelor's degree or higher, proportion of people aged 25 and up, 2015-2019 : | 58.2% |
| Percentage of people under the age of 65 who have a disability, 2015-2019 : | 3.7% |
| Persons under the age of 65 who do not have health insurance, as a percentage : | 2.6% |
| Total civilian labor force, percent of population aged 16 and up, 2015-2019 : | 66.5% |
| Female labor force participation in the civilian labor force, as a percentage of the population aged 16 and up, 2015-2019 : | 61.0% |
| Total sales of lodging and food services in 2012 ($1,000) : | 8,161 |
| Total receipts/revenue for health care and social assistance in 2012 ($1,000) : | 64,137 |
| 2012 total retail sales ($1,000) : | 38,769 |
| 2012 total retail sales per capita : | $2,843 |
| Mean commute time to work (in minutes), workers aged 16 and up, 2015-2019 : | 31.1 |
| 2015-2019 median household income (in 2019 dollars) : | $105,783 |
| Income per capita in the previous 12 months (in 2019 dollars), 2015-2019 : | $49,663 |
| Percentage of people living in poverty : | 4.6% |
| Total number of businesses in 2012 : | 861 |
| Men-owned businesses in 2012 : | 550 |
| Women-owned businesses in 2012 : | 256 |
| Minority-owned businesses in 2012 : | 47 |
| Non-minority-owned businesses in 2012 : | 772 |
| Veteran-owned businesses in 2012 : | 191 |
| Nonveteran-owned businesses in 2012 : | 629 |
| 2010 population per square mile : | 6,084.6 |
| 2010 land area in square miles : | 2.23 |
| Rate of owner-occupied housing units, 2015-2019 : | 83.3% |
| Owner-occupied housing unit median value, 2015-2019 : | $396,100 |
| From 2015 to 2019, the median selected monthly owner costs - with a mortgage : | $2,594 |
| Monthly owner costs, without a mortgage, at the median, 2015-2019 : | $1,094 |
| 2015-2019 median gross rent : | $1,894 |
| 2015-2019 Households : | 4,298 |
| Population per household, 2015-2019 : | 2.88 |
| Living in the same house a year ago, percentage of people aged one year and up, 2015-2019 : | 92.1% |
| Languages other than English spoken at home, as a percentage of people aged 5 and up, 2015-2019 : | 58.8% |
| Households with computers, %, 2015-2019 : | 84.9% |
| Percentage of households with a broadband Internet subscription, 2015-2019 : | 80.2% |
| Percentage of people aged 25 and up with a high school diploma or higher, 2015-2019 : | 90.5% |
| Bachelor's degree or higher, proportion of people aged 25 and up, 2015-2019 : | 53.6% |
| Percentage of people under the age of 65 who have a disability, 2015-2019 : | 5.3% |
| Persons under the age of 65 who do not have health insurance, as a percentage : | 7.4% |
| Total civilian labor force, percent of population aged 16 and up, 2015-2019 : | 53.3% |
| Female labor force participation in the civilian labor force, as a percentage of the population aged 16 and up, 2015-2019 : | 45.6% |
| Total sales of lodging and food services in 2012 ($1,000) : | 55,211 |
| Total receipts/revenue for health care and social assistance in 2012 ($1,000) : | 93,874 |
| Manufacturers' total shipments in 2012 ($1,000) : | 235,713 |
| 2012 total retail sales ($1,000) : | 637,985 |
| 2012 total retail sales per capita : | $50,410 |
| Mean commute time to work (in minutes), workers aged 16 and up, 2015-2019 : | 29.2 |
| 2015-2019 median household income (in 2019 dollars) : | $95,030 |
| Income per capita in the previous 12 months (in 2019 dollars), 2015-2019 : | $44,084 |
| Percentage of people living in poverty : | 6.2% |
| Total number of businesses in 2012 : | 2,208 |
| Men-owned businesses in 2012 : | 1,243 |
| Women-owned businesses in 2012 : | 578 |
| Minority-owned businesses in 2012 : | 440 |
| Non-minority-owned businesses in 2012 : | 1,647 |
| Veteran-owned businesses in 2012 : | 58 |
| Nonveteran-owned businesses in 2012 : | 1,971 |
| 2010 population per square mile : | 4,677.7 |
| 2010 land area in square miles : | 2.69 |
| Rate of owner-occupied housing units, 2015-2019 : | 77.6% |
| Owner-occupied housing unit median value, 2015-2019 : | $194,200 |
| From 2015 to 2019, the median selected monthly owner costs - with a mortgage : | $1,778 |
| Monthly owner costs, without a mortgage, at the median, 2015-2019 : | $740 |
| 2015-2019 median gross rent : | $1,080 |
| 2015-2019 Households : | 10,275 |
| Population per household, 2015-2019 : | 2.68 |
| Living in the same house a year ago, percentage of people aged one year and up, 2015-2019 : | 94.3% |
| Languages other than English spoken at home, as a percentage of people aged 5 and up, 2015-2019 : | 15.4% |
| Households with computers, %, 2015-2019 : | 91.3% |
| Percentage of households with a broadband Internet subscription, 2015-2019 : | 87.3% |
| Percentage of people aged 25 and up with a high school diploma or higher, 2015-2019 : | 90.7% |
| Bachelor's degree or higher, proportion of people aged 25 and up, 2015-2019 : | 31.5% |
| Percentage of people under the age of 65 who have a disability, 2015-2019 : | 6.1% |
| Persons under the age of 65 who do not have health insurance, as a percentage : | 8.0% |
| Total civilian labor force, percent of population aged 16 and up, 2015-2019 : | 70.6% |
| Female labor force participation in the civilian labor force, as a percentage of the population aged 16 and up, 2015-2019 : | 66.2% |
| Total sales of lodging and food services in 2012 ($1,000) : | 28,304 |
| 2012 total retail sales ($1,000) : | 184,455 |
| 2012 total retail sales per capita : | $6,551 |
| Mean commute time to work (in minutes), workers aged 16 and up, 2015-2019 : | 31.7 |
| 2015-2019 median household income (in 2019 dollars) : | $76,945 |
| Income per capita in the previous 12 months (in 2019 dollars), 2015-2019 : | $34,257 |
| Percentage of people living in poverty : | 5.3% |
| Total number of businesses in 2012 : | 2,220 |
| Men-owned businesses in 2012 : | 1,399 |
| Women-owned businesses in 2012 : | 680 |
| Minority-owned businesses in 2012 : | 386 |
| Non-minority-owned businesses in 2012 : | 1,786 |
| Veteran-owned businesses in 2012 : | 202 |
| Nonveteran-owned businesses in 2012 : | 1,928 |
| 2010 population per square mile : | 4,698.3 |
| 2010 land area in square miles : | 5.95 |
Best Things to Do in Jasper
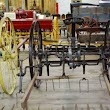
1Dubois County Museum Inc
2704 N Newton St, Jasper, IN 47546, United States View details
Phone: +18126347733 | Website available
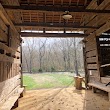
2Schaeffer Barn
401-499 E 4th St, Jasper, IN 47546, United States View details
3Jasper Riverwalk Labyrinth
Jasper, IN 47546, United States View details

Services and Civic Places in Jasper
1USDA Agricultural Services Center
1486 Executive Blvd, Jasper, IN 47546, United States View details
Phone: +18124821171 | Website available
People born in Jasper (11)
People born in Jasper, including politician Brad Ellsworth, Roman Catholic archbishop in the United States Daniel M. Buechlein, politician Charles Hall Dillon, .
More notable people
- Frank W. Milburn (United States general, American football coach, college athletics administrator) he was born in 11/01/1892
- Bernard V. Vonderschmitt (American electrical engineer) he was born in 14/10/1923
- Edith Pfau (painter, sculptor and art educator from the USA (1915-2001)) she was born in 15/07/1915
- Mark Messmer (American politician)
- Matt Mauck (American football player) he was born in 12/02/1979
- Mark Riggins (American baseball coach) he was born in 03/01/1957
- Mike Braun (United States Senator from Indiana) he was born in 24/03/1954
- Lexi Graber (American artistic gymnast) she was born in 12/02/1999
Nearby Schools and Colleges
Schools and campuses linked to Jasper, IN. Select a name to open its map and contact details.
| Code | Name | City | ZIP |
|---|---|---|---|
| 152451 | Saint Meinrad School of Theology | St. Meinrad (IN) | 47577 |
Nearby Transit Stations (2)
Rail and bus stations connected to Jasper, IN. Select a station to open its map and address details.
| Code | Name | Address | Type |
|---|---|---|---|
| EVN | Evansville, IN | 119 Northwest 6th Street | BUS |
| LVL | Louisville, Kentucky | 720 West Muhammad Ali Blvd. | BUS |
Closest post offices linked to Jasper.
| Post Office Name | City | ZIP |
|---|---|---|
| Jasper Post Office | Jasper (IN) | 47546 |
Other places with the same name (11)
- Jasper, Alabama city in Walker County, Alabama, United States with a population of 13,278 people.
- Jasper, Texas city in Texas, United States with a population of 7,597 people.
- Jasper, Florida city in Hamilton County, Florida, USA with a population of 4,163 people.
- Jasper, Georgia city in Pickens County, Georgia, United States with a population of 4,037 people.
- Jasper, Tennessee Tennessee town with a population of 3,412 people.
- Jasper, New York town in New York state with a population of 1,356 people.
- Jasper, Michigan township in Lenawee County, Michigan with a population of 1,141 people.
- Jasper, Missouri city in Missouri, United States with a population of 966 people.
- Jasper, Ohio human settlement in Ohio, United States of America with a population of 725 people.
- Jasper, Arkansas city in Newton County, Arkansas, United States with a population of 479 people.
- Jasper, Minnesota city in Minnesota, United States with a population of 66 people.
Other cities in Dubois County
Cities, towns, neighborhoods & other populated places in Dubois County , IN.
| City Name | Population | Title |
|---|---|---|
| Huntingburg | 6,297 | City in Dubois County, Indiana, United States of America |
| Ferdinand | 2,253 | Town in Indiana, United States |
| Holland | 646 | Town in Indiana, United States |
| Birdseye | 416 | Town in Dubois County, Indiana, United States |
Distance to Other Cities
Jasper distances to largest Indiana cities