Hebron, Ohio
Hebron: town in Ohio, USA
About
Hebron is a town located in the county of Licking in the U.S. state of Ohio. Its population at the 2010 census was 2,336 and a population density of 304 people per km². After 10 years in 2020 city had an estimated population of 2,497 inhabitants.

Quick Facts about Hebron
| Population | 2,497 (2020) |
| Country | United States of America |
| State | Ohio (United States) |
| County | Licking County |
| Area | 7.68 km2 |
| Latitude & Longitude | 39.9617,-82.4913 |
| Altitude | 889 feet / 271 meters |
| Time Zone | America/New_York |
| Local time | 09:53:21 (14th July 2026) |
| Postal code | 43025 |
| Density | 325 Pop. per km² as of 2020 |
| Population growth | 6.45% (2010-2020) |
| Weather | 89℉ Sunny 7-days weather |

Geography
Hebron is located at 39°57'42"N 82°29'29"W (39.9617300, -82.4912700).
Hebron map
Demographics
The population of Hebron increased by 6.45% in 10 years.
| Year | Population | % Change | Method |
|---|---|---|---|
| 2010 | 2,336 | - | census |
| 2011 | 2,345 | 0.38% | estimation process |
| 2012 | 2,348 | 0.13% | estimation process |
| 2013 | 2,361 | 0.55% | estimation process |
| 2014 | 2,375 | 0.59% | estimation process |
| 2015 | 2,392 | 0.71% | estimation process |
| 2016 | 2,411 | 0.79% | estimation process |
| 2017 | 2,432 | 0.86% | estimation process |
| 2018 | 2,460 | 1.14% | estimation process |
| 2019 | 2,477 | 0.69% | estimation process |
| 2020 | 2,497 | 0.8% | estimation process |
Demographic Facts
| Estimated population as of July 1, 2019 : | 6,072 |
| Based on demographic estimates as of April 1, 2010 : | 5,740 |
| Based on demographic estimates as of 1 April 2010 : | 5.8% |
| April 1, 2020 Population : | 6,078 |
| April 1, 2010 Population : | 5,760 |
| People under 5 years old, percentage : | 4.0% |
| People under 18 years old, percentage : | 23.6% |
| People over 65 (%) : | 21.8% |
| Female persons, % : | 52.6% |
| White only, percent : | 91.1% |
| Black or African American alone, percent : | 6.7% |
| American Indian and Alaska Native only, % : | 0.3% |
| Asians alone % : | 0.2% |
| Only Native Hawaiians and Other Pacific Islanders, % : | 0.0% |
| % of people who have participated in two or more races : | 1.4% |
| % of Hispanic or Latino : | 2.6% |
| White people, not Hispanic or Latino people, make up the majority of the population. : | 88.9% |
| 2015-2019 Veterans : | 356 |
| Percentage of foreign-born people, 2015-2019 : | 1.3% |
| Rate of owner-occupied housing units, 2015-2019 : | 62.0% |
Economic Facts
| Rate of owner-occupied housing units, 2015-2019 : | 62.0% |
| Owner-occupied housing unit median value, 2015-2019 : | $125,600 |
| From 2015 to 2019, the median selected monthly owner costs - with a mortgage : | $1,089 |
| Monthly owner costs, without a mortgage, at the median, 2015-2019 : | $444 |
| 2015-2019 median gross rent : | $754 |
| 2015-2019 Households : | 2,434 |
| Population per household, 2015-2019 : | 2.38 |
| Living in the same house a year ago, percentage of people aged one year and up, 2015-2019 : | 90.0% |
| Languages other than English spoken at home, as a percentage of people aged 5 and up, 2015-2019 : | 2.2% |
| Households with computers, %, 2015-2019 : | 80.5% |
| Percentage of households with a broadband Internet subscription, 2015-2019 : | 73.1% |
| Percentage of people aged 25 and up with a high school diploma or higher, 2015-2019 : | 88.6% |
| Bachelor's degree or higher, proportion of people aged 25 and up, 2015-2019 : | 16.9% |
| Percentage of people under the age of 65 who have a disability, 2015-2019 : | 12.8% |
| Persons under the age of 65 who do not have health insurance, as a percentage : | 14.0% |
| Total civilian labor force, percent of population aged 16 and up, 2015-2019 : | 52.1% |
| Female labor force participation in the civilian labor force, as a percentage of the population aged 16 and up, 2015-2019 : | 43.6% |
| Total sales of lodging and food services in 2012 ($1,000) : | 6,390 |
| Total receipts/revenue for health care and social assistance in 2012 ($1,000) : | 17,972 |
| 2012 total retail sales ($1,000) : | 100,103 |
| 2012 total retail sales per capita : | $17,247 |
| Mean commute time to work (in minutes), workers aged 16 and up, 2015-2019 : | 23.8 |
| 2015-2019 median household income (in 2019 dollars) : | $43,977 |
| Income per capita in the previous 12 months (in 2019 dollars), 2015-2019 : | $23,163 |
| Percentage of people living in poverty : | 16.5% |
| Total number of businesses in 2012 : | 424 |
| Men-owned businesses in 2012 : | 226 |
| Women-owned businesses in 2012 : | 153 |
| Minority-owned businesses in 2012 : | F |
| Non-minority-owned businesses in 2012 : | 370 |
| Veteran-owned businesses in 2012 : | 63 |
| Nonveteran-owned businesses in 2012 : | 323 |
| 2010 population per square mile : | 1,048.9 |
| 2010 land area in square miles : | 5.49 |
Best Things to Do in Hebron
1Ohio Canal Greenway
Unnamed Road, Hebron, OH 43025, United States View details
Phone: +17403494823 | Website available

Where to Eat in Hebron
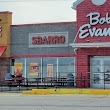
1Bob Evans
Inside Travelcenter 10679, Lancaster Rd, Hebron, OH 43025, United States View details
Phone: +17404672288 | Website available

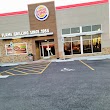
2Popeyes Louisiana Kitchen
10679 Lancaster Rd, Hebron, OH 43025, United States View details
Phone: +17404672900 | Website available

3Subway
10258 Lancaster Rd SW, Hebron, OH 43025, United States View details
Phone: +17409286128 | Website available

4Sbarro
10672 Lancaster Rd, Hebron, OH 43025, United States View details
Website available
5Burger King
608 E Main St, Hebron, OH 43025, United States View details
Phone: +17408220037 | Website available
Where to Stay in Hebron
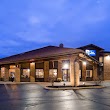
1Best Western Lakewood Inn
122 Arrowhead Dr, Hebron, OH 43025, United States View details
Phone: +17409281800 | Website available
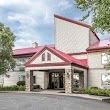
2Red Roof Inn Columbus - Hebron
10668 Lancaster Rd Sw, Hebron, OH 43025, United States View details
Phone: +17404677663 | Website available
People born in Hebron (1)
ethnographer of North American Indians, especially the Mandan tribe George Amos Dorsey was born in Hebron
Nearby Schools and Colleges
Schools and campuses linked to Hebron, OH. Select a name to open its map and contact details.
| Code | Name | City | ZIP |
|---|---|---|---|
| 405012 | Ohio State School of Cosmetology-Heath | Heath (OH) | 43056 |
Nearby Transit Stations (1)
Rail and bus stations connected to Hebron, OH. Select a station to open its map and address details.
| Code | Name | Address | Type |
|---|---|---|---|
| COL | Columbus, OH | 111 East Town Street | BUS |
Closest post offices linked to Hebron.
| Post Office Name | City | ZIP |
|---|---|---|
| Hebron Post Office | Hebron (OH) | 43025 |
Other places with the same name (12)
- Hebron, Connecticut town in Connecticut, United States with a population of 9,480 people.
- Hebron, Kentucky census-designated place in Boone County, Kentucky with a population of 5,929 people.
- Hebron, Indiana city in Porter County, Indiana, United States of America with a population of 3,669 people.
- Hebron, Nebraska county seat of Thayer County, Nebraska, United States with a population of 1,434 people.
- Hebron, Maine town in Maine with a population of 1,431 people.
- Hebron, Wisconsin town of Wisconsin with a population of 1,132 people.
- Hebron, Illinois human settlement in Illinois, United States of America with a population of 1,114 people.
- Hebron, Maryland town of the United States with a population of 1,096 people.
- Hebron, New Hampshire town in Grafton County, New Hampshire, USA with a population of 633 people.
- Hebron, Pennsylvania census-designated place in Lebanon County, Pennsylvania with a population of 557 people.
- Hebron, Texas human settlement in Texas, United States of America with a population of 212 people.
- Hebron, North Dakota city in Morton County, North Dakota with a population of 47 people.
Other cities in Licking County
Cities, towns, neighborhoods & other populated places in Licking County , OH.
| City Name | Population | Title |
|---|---|---|
| Pataskala | 16,010 | City in Licking County, Ohio, United States |
| Heath | 10,489 | City in Ohio, USA |
| Granville | 5,827 | Village in Ohio, United States |
| Johnstown | 5,127 | Village in Licking County, Ohio, United States |
| Beechwood Trails | 3,020 | Census designated place |
| Buckeye Lake | 2,893 | Village in Ohio, United States |
| Jersey | 2,765 | Human settlement in United States of America |
| Chatham | 2,396 | Human settlement in Ohio, United States of America |
| Newark | 2,152 | City in Ohio, USA |
| Harbor Hills | 1,509 | Census-designated place in Licking County, Ohio |
| Homer | 1,014 | Human settlement in Ohio, United States of America |
| Kirkersville | 557 | Human settlement in Licking County, Ohio, United States of America |
| Amsterdam | 469 | Human settlement in Jefferson County, Ohio, United States of America |
| Saint Louisville | 383 | Village in Licking County, Ohio, United States |
| Gratiot | 221 | Human settlement in Ohio, United States of America |
Distance to Other Cities
Hebron distances to largest Ohio cities