Greenland, Arkansas
Greenland: city in Arkansas, USA
About
Greenland is a city located in the county of Washington in the U.S. state of Arkansas. Its population at the 2010 census was 1,259. After 10 years in 2020 city had an estimated population of 1,397 inhabitants.
Quick Facts about Greenland
| Population | 1,397 (2020) |
| Country | United States of America |
| State | Arkansas (United States) |
| County | Washington County |
| Postal code | 72737 |
| Phone Area Codes | 479 |
| Water as percent of area | 0.75% |
| Land as percent of area | 99.25% |
| Latitude & Longitude | 35.9943,-94.1752 |
| Altitude | 1,250 feet / 381 meters |
| Time Zone | America/Chicago |
| Local time | 20:08:33 (16th July 2026) |
| Population growth | 9.88% (2010-2020) |
| Weather | 84℉ Chance Showers And Thunderstorms 7-days weather |
Geography
Greenland is located at 35°59'39"N 94°10'31"W (35.9942500, -94.1752000).
Greenland map
Weather
A slight chance of rain showers between 7am and 10am, then a chance of showers and thunderstorms. Mostly sunny, with a high near 84. Southwest wind 0...
7-Day ForecastOfficial website of Greenland
Official WebsiteDemographics
The population of Greenland increased by 9.88% in 10 years.
| Year | Population | % Change | Method |
|---|---|---|---|
| 2010 | 1,259 | - | census |
| 2011 | 1,308 | 3.75% | estimation process |
| 2012 | 1,325 | 1.28% | estimation process |
| 2013 | 1,345 | 1.49% | estimation process |
| 2014 | 1,358 | 0.96% | estimation process |
| 2015 | 1,372 | 1.02% | estimation process |
| 2016 | 1,384 | 0.87% | estimation process |
| 2017 | 1,395 | 0.79% | estimation process |
| 2018 | 1,405 | 0.71% | estimation process |
| 2019 | 1,403 | -0.14% | estimation process |
| 2020 | 1,397 | -0.43% | estimation process |
Demographic Facts
| Estimated population as of July 1, 2019 : | 5,665 |
| Based on demographic estimates as of April 1, 2010 : | 4,715 |
| Based on demographic estimates as of 1 April 2010 : | 20.1% |
| April 1, 2020 Population : | 5,707 |
| April 1, 2010 Population : | 4,706 |
| People under 5 years old, percentage : | 9.3% |
| People under 18 years old, percentage : | 30.6% |
| People over 65 (%) : | 13.2% |
| Female persons, % : | 50.9% |
| White only, percent : | 94.7% |
| Black or African American alone, percent : | 1.6% |
| American Indian and Alaska Native only, % : | 0.3% |
| Asians alone % : | 0.0% |
| Only Native Hawaiians and Other Pacific Islanders, % : | 0.0% |
| % of people who have participated in two or more races : | 3.4% |
| % of Hispanic or Latino : | 2.5% |
| White people, not Hispanic or Latino people, make up the majority of the population. : | 92.2% |
| 2015-2019 Veterans : | 380 |
| Percentage of foreign-born people, 2015-2019 : | 0.6% |
| Rate of owner-occupied housing units, 2015-2019 : | 57.7% |
Economic Facts
| Rate of owner-occupied housing units, 2015-2019 : | 57.7% |
| Owner-occupied housing unit median value, 2015-2019 : | $141,200 |
| From 2015 to 2019, the median selected monthly owner costs - with a mortgage : | $1,080 |
| Monthly owner costs, without a mortgage, at the median, 2015-2019 : | $365 |
| 2015-2019 median gross rent : | $847 |
| 2015-2019 Households : | 2,014 |
| Population per household, 2015-2019 : | 2.72 |
| Living in the same house a year ago, percentage of people aged one year and up, 2015-2019 : | 84.0% |
| Languages other than English spoken at home, as a percentage of people aged 5 and up, 2015-2019 : | 3.4% |
| Households with computers, %, 2015-2019 : | 94.3% |
| Percentage of households with a broadband Internet subscription, 2015-2019 : | 69.7% |
| Percentage of people aged 25 and up with a high school diploma or higher, 2015-2019 : | 93.5% |
| Bachelor's degree or higher, proportion of people aged 25 and up, 2015-2019 : | 19.0% |
| Percentage of people under the age of 65 who have a disability, 2015-2019 : | 10.5% |
| Persons under the age of 65 who do not have health insurance, as a percentage : | 8.2% |
| Total civilian labor force, percent of population aged 16 and up, 2015-2019 : | 59.1% |
| Female labor force participation in the civilian labor force, as a percentage of the population aged 16 and up, 2015-2019 : | 51.5% |
| Total receipts/revenue for health care and social assistance in 2012 ($1,000) : | 17,869 |
| 2012 total retail sales ($1,000) : | 56,842 |
| 2012 total retail sales per capita : | $11,387 |
| Mean commute time to work (in minutes), workers aged 16 and up, 2015-2019 : | 29.9 |
| 2015-2019 median household income (in 2019 dollars) : | $47,028 |
| Income per capita in the previous 12 months (in 2019 dollars), 2015-2019 : | $21,796 |
| Percentage of people living in poverty : | 19.1% |
| Total number of businesses in 2012 : | 647 |
| Men-owned businesses in 2012 : | 366 |
| Women-owned businesses in 2012 : | 215 |
| Minority-owned businesses in 2012 : | F |
| Non-minority-owned businesses in 2012 : | 603 |
| Veteran-owned businesses in 2012 : | F |
| Nonveteran-owned businesses in 2012 : | 597 |
| 2010 population per square mile : | 594.3 |
| 2010 land area in square miles : | 7.92 |
| Rate of owner-occupied housing units, 2015-2019 : | 36.6% |
| Owner-occupied housing unit median value, 2015-2019 : | $207,600 |
| From 2015 to 2019, the median selected monthly owner costs - with a mortgage : | $1,402 |
| Monthly owner costs, without a mortgage, at the median, 2015-2019 : | $428 |
| 2015-2019 median gross rent : | $799 |
| 2015-2019 Households : | 35,288 |
| Population per household, 2015-2019 : | 2.21 |
| Living in the same house a year ago, percentage of people aged one year and up, 2015-2019 : | 70.7% |
| Languages other than English spoken at home, as a percentage of people aged 5 and up, 2015-2019 : | 9.4% |
| Households with computers, %, 2015-2019 : | 95.4% |
| Percentage of households with a broadband Internet subscription, 2015-2019 : | 84.2% |
| Percentage of people aged 25 and up with a high school diploma or higher, 2015-2019 : | 93.5% |
| Bachelor's degree or higher, proportion of people aged 25 and up, 2015-2019 : | 50.2% |
| Percentage of people under the age of 65 who have a disability, 2015-2019 : | 6.6% |
| Persons under the age of 65 who do not have health insurance, as a percentage : | 9.0% |
| Total civilian labor force, percent of population aged 16 and up, 2015-2019 : | 62.7% |
| Female labor force participation in the civilian labor force, as a percentage of the population aged 16 and up, 2015-2019 : | 58.9% |
| Total sales of lodging and food services in 2012 ($1,000) : | 270,364 |
| Total receipts/revenue for health care and social assistance in 2012 ($1,000) : | 985,216 |
| Manufacturers' total shipments in 2012 ($1,000) : | 1,031,737 |
| 2012 total retail sales ($1,000) : | 1,766,754 |
| 2012 total retail sales per capita : | $22,975 |
| Mean commute time to work (in minutes), workers aged 16 and up, 2015-2019 : | 19.0 |
| 2015-2019 median household income (in 2019 dollars) : | $43,690 |
| Income per capita in the previous 12 months (in 2019 dollars), 2015-2019 : | $28,508 |
| Percentage of people living in poverty : | 22.9% |
| Total number of businesses in 2012 : | 7,467 |
| Men-owned businesses in 2012 : | 3,577 |
| Women-owned businesses in 2012 : | 2,501 |
| Minority-owned businesses in 2012 : | 661 |
| Non-minority-owned businesses in 2012 : | 6,202 |
| Veteran-owned businesses in 2012 : | 575 |
| Nonveteran-owned businesses in 2012 : | 5,970 |
| 2010 population per square mile : | 1,366.4 |
| 2010 land area in square miles : | 53.85 |
| Residential units, July 1, 2019 : | 8,168 |
| Rate of owner-occupied housing units, 2015-2019 : | 74.9% |
| Owner-occupied housing unit median value, 2015-2019 : | $94,300 |
| From 2015 to 2019, the median selected monthly owner costs - with a mortgage : | $967 |
| Monthly owner costs, without a mortgage, at the median, 2015-2019 : | $434 |
| 2015-2019 median gross rent : | $639 |
| Permits for construction, 2020 : | 15 |
| 2015-2019 Households : | 7,148 |
| Population per household, 2015-2019 : | 2.27 |
| Living in the same house a year ago, percentage of people aged one year and up, 2015-2019 : | 88.1% |
| Languages other than English spoken at home, as a percentage of people aged 5 and up, 2015-2019 : | 3.8% |
| Households with computers, %, 2015-2019 : | 83.7% |
| Percentage of households with a broadband Internet subscription, 2015-2019 : | 72.7% |
| Percentage of people aged 25 and up with a high school diploma or higher, 2015-2019 : | 92.4% |
| Bachelor's degree or higher, proportion of people aged 25 and up, 2015-2019 : | 20.8% |
| Percentage of people under the age of 65 who have a disability, 2015-2019 : | 7.3% |
| Persons under the age of 65 who do not have health insurance, as a percentage : | 5.9% |
| Total civilian labor force, percent of population aged 16 and up, 2015-2019 : | 61.4% |
| Female labor force participation in the civilian labor force, as a percentage of the population aged 16 and up, 2015-2019 : | 57.8% |
| Total sales of lodging and food services in 2012 ($1,000) : | 14,619 |
| Total receipts/revenue for health care and social assistance in 2012 ($1,000) : | 69,816 |
| Manufacturers' total shipments in 2012 ($1,000) : | 1,272,668 |
| 2012 total retail sales ($1,000) : | 175,878 |
| 2012 total retail sales per capita : | $10,165 |
| Mean commute time to work (in minutes), workers aged 16 and up, 2015-2019 : | 18.6 |
| 2015-2019 median household income (in 2019 dollars) : | $54,196 |
| Income per capita in the previous 12 months (in 2019 dollars), 2015-2019 : | $28,770 |
| Percentage of people living in poverty : | 10.6% |
| Total number of employer establishments, 2019 : | 546 |
| 2019 total employment : | 5,046 |
| 2019 total annual payroll ($1,000) : | 194,299 |
| Total employment, change in percentage terms, 2018-2019 : | -6.4% |
| 2018 total non-employer establishments : | 1,233 |
| Total number of businesses in 2012 : | 2,061 |
| Men-owned businesses in 2012 : | 1,108 |
| Women-owned businesses in 2012 : | 599 |
| Minority-owned businesses in 2012 : | 51 |
| Non-minority-owned businesses in 2012 : | 1,883 |
| Veteran-owned businesses in 2012 : | 239 |
| Nonveteran-owned businesses in 2012 : | 1,638 |
| 2010 population per square mile : | 30.8 |
| 2010 land area in square miles : | 569.31 |
Nearby Schools and Colleges
Schools and campuses linked to Greenland, AR. Select a name to open its map and contact details.
| Code | Name | City | ZIP |
|---|---|---|---|
| 106397 | University of Arkansas | Fayetteville (AR) | 72701 |
Closest post offices linked to Greenland.
| Post Office Name | City | ZIP |
|---|---|---|
| Greenland Post Office | Greenland (AR) | 72737 |
Other places with the same name (2)
- Greenland, New Hampshire city in Rockingham County, New Hampshire, United States of America with a population of 4,114 people.
- Greenland, Michigan township in Ontonagon County, Michigan with a population of 644 people.
Other cities in Washington County
Cities, towns, neighborhoods & other populated places in Washington County , AR.
| City Name | Population | Title |
|---|---|---|
| Fayetteville | 89,576 | The most populous city in Washington County, Arkansas. |
| Springdale | 81,115 | The most populous city in Washington County, Arkansas. |
| Farmington | 7,569 | City in Arkansas, USA |
| Prairie Grove | 7,049 | City in Arkansas, USA |
| Tontitown | 6,065 | Township in Washington County, Arkansas |
| Elkins | 3,664 | Township in Washington County, Arkansas |
| Johnson | 3,634 | City in Arkansas, USA |
| West Fork | 2,623 | City in Arkansas, USA |
| Lincoln | 2,473 | City in Arkansas, USA |
| Elm Springs | 2,418 | City in Arkansas, USA |
| Goshen | 1,985 | Town in Arkansas, United States |
| Winslow | 416 | City in Washington County, Arkansas, United States |
Distance to Other Cities
Greenland distances to largest Arkansas cities
- Little Rock
- Fayetteville
- Fort Smith
- Springdale
- Jonesboro
- Rogers
- Conway
- North Little Rock
- Bentonville
- Pine Bluff
Map & Images (more maps)
Coca Cola Gm 2007
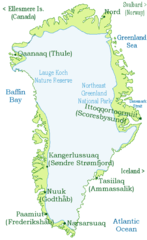
Disko Bay
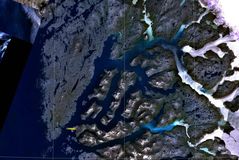
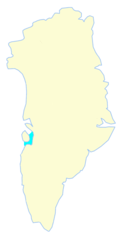
Godthaabsfjord
Greenland Nuussuaq Peninsula
Greenland Disko Bay
Greenland Ittoqqortoormiit
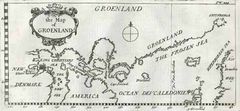
Greenland Map 17th Century
Greenland Big
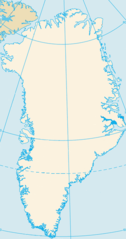
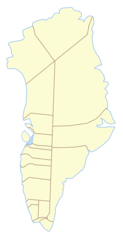
Greenland Blank Map
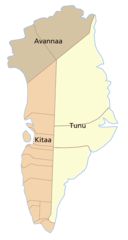
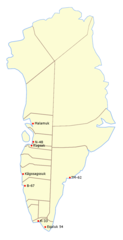
Greenland Counties
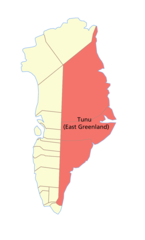
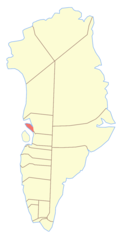
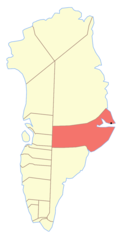
Greenland East
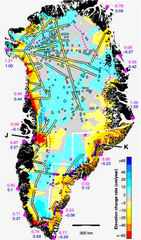
Greenland Ice Sheet Thinning Rate
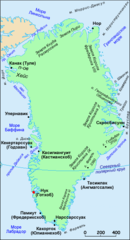
Greenland Map
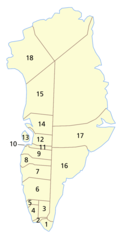
Greenland Municipalities Numbered
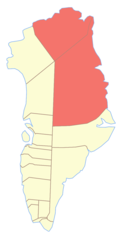
Greenland Nat Park
Greenland North
Greenland West
Greenland Cia Wfb Map
Greenlandworldmap
Greenlandlocatormap