Gardner, Illinois
Gardner: village in Illinois, United States
About
Gardner is a village located in the county of Grundy in the U.S. state of Illinois. Its population at the 2010 census was 1,463 and a population density of 499 people per km². After 10 years in 2020 city had an estimated population of 1,377 inhabitants.
Quick Facts about Gardner
| Population | 1,377 (2020) |
| Country | United States of America |
| State | Illinois (United States) |
| County | Grundy County |
| Postal code | 60424 |
| Area | 2.93 km2 |
| Latitude & Longitude | 41.1856,-88.3098 |
| Altitude | 1,919 feet / 585 meters |
| Time Zone | America/Chicago |
| Local time | 07:47:47 (14th July 2026) |
| Density | 470 Pop. per km² as of 2020 |
| Population growth | -6.25% (2010-2020) |
| Weather | 90℉ Sunny 7-days weather |
Geography
Gardner is located at 41°11'8"N 88°18'35"W (41.1855900, -88.3097800).
Gardner map
Demographics
According to census records, the population of Gardner decreased by 6.25% in 10 years.
| Year | Population | % Change | Method |
|---|---|---|---|
| 2010 | 1,463 | - | census |
| 2011 | 1,471 | 0.54% | estimation process |
| 2012 | 1,464 | -0.48% | estimation process |
| 2013 | 1,455 | -0.62% | estimation process |
| 2014 | 1,446 | -0.62% | estimation process |
| 2015 | 1,435 | -0.77% | estimation process |
| 2016 | 1,421 | -0.99% | estimation process |
| 2017 | 1,412 | -0.64% | estimation process |
| 2018 | 1,407 | -0.36% | estimation process |
| 2019 | 1,393 | -1.01% | estimation process |
| 2020 | 1,377 | -1.16% | estimation process |
Demographic Facts
| Estimated population as of July 1, 2019 : | 66,749 |
| Based on demographic estimates as of April 1, 2010 : | 66,931 |
| Based on demographic estimates as of 1 April 2010 : | -0.3% |
| April 1, 2020 Population : | 71,576 |
| April 1, 2010 Population : | 66,748 |
| People under 5 years old, percentage : | 6.7% |
| People under 18 years old, percentage : | 22.0% |
| People over 65 (%) : | 13.2% |
| Female persons, % : | 49.5% |
| White only, percent : | 71.0% |
| Black or African American alone, percent : | 3.5% |
| American Indian and Alaska Native only, % : | 0.4% |
| Asians alone % : | 13.6% |
| Only Native Hawaiians and Other Pacific Islanders, % : | 0.1% |
| % of people who have participated in two or more races : | 7.6% |
| % of Hispanic or Latino : | 16.0% |
| White people, not Hispanic or Latino people, make up the majority of the population. : | 60.3% |
| 2015-2019 Veterans : | 2,993 |
| Percentage of foreign-born people, 2015-2019 : | 19.5% |
| Rate of owner-occupied housing units, 2015-2019 : | 51.9% |
Economic Facts
| Rate of owner-occupied housing units, 2015-2019 : | 51.9% |
| Owner-occupied housing unit median value, 2015-2019 : | $926,500 |
| From 2015 to 2019, the median selected monthly owner costs - with a mortgage : | $3,475 |
| Monthly owner costs, without a mortgage, at the median, 2015-2019 : | $720 |
| 2015-2019 median gross rent : | $2,072 |
| 2015-2019 Households : | 27,663 |
| Population per household, 2015-2019 : | 2.43 |
| Living in the same house a year ago, percentage of people aged one year and up, 2015-2019 : | 86.2% |
| Languages other than English spoken at home, as a percentage of people aged 5 and up, 2015-2019 : | 24.2% |
| Households with computers, %, 2015-2019 : | 96.9% |
| Percentage of households with a broadband Internet subscription, 2015-2019 : | 93.3% |
| Percentage of people aged 25 and up with a high school diploma or higher, 2015-2019 : | 96.7% |
| Bachelor's degree or higher, proportion of people aged 25 and up, 2015-2019 : | 60.8% |
| Percentage of people under the age of 65 who have a disability, 2015-2019 : | 4.1% |
| Persons under the age of 65 who do not have health insurance, as a percentage : | 3.8% |
| Total civilian labor force, percent of population aged 16 and up, 2015-2019 : | 72.2% |
| Female labor force participation in the civilian labor force, as a percentage of the population aged 16 and up, 2015-2019 : | 68.0% |
| Total sales of lodging and food services in 2012 ($1,000) : | 247,461 |
| Total receipts/revenue for health care and social assistance in 2012 ($1,000) : | 211,291 |
| 2012 total retail sales ($1,000) : | 869,741 |
| 2012 total retail sales per capita : | $12,848 |
| Mean commute time to work (in minutes), workers aged 16 and up, 2015-2019 : | 31.1 |
| 2015-2019 median household income (in 2019 dollars) : | $113,499 |
| Income per capita in the previous 12 months (in 2019 dollars), 2015-2019 : | $62,528 |
| Percentage of people living in poverty : | 3.9% |
| Total number of businesses in 2012 : | 9,648 |
| Men-owned businesses in 2012 : | 5,136 |
| Women-owned businesses in 2012 : | 3,610 |
| Minority-owned businesses in 2012 : | 2,543 |
| Non-minority-owned businesses in 2012 : | 6,614 |
| Veteran-owned businesses in 2012 : | 664 |
| Nonveteran-owned businesses in 2012 : | 8,672 |
| 2010 population per square mile : | 10,768.7 |
| 2010 land area in square miles : | 6.20 |
| Rate of owner-occupied housing units, 2015-2019 : | 56.5% |
| Owner-occupied housing unit median value, 2015-2019 : | $410,400 |
| From 2015 to 2019, the median selected monthly owner costs - with a mortgage : | $2,300 |
| Monthly owner costs, without a mortgage, at the median, 2015-2019 : | $704 |
| 2015-2019 median gross rent : | $1,134 |
| 2015-2019 Households : | 4,879 |
| Population per household, 2015-2019 : | 2.82 |
| Living in the same house a year ago, percentage of people aged one year and up, 2015-2019 : | 93.1% |
| Languages other than English spoken at home, as a percentage of people aged 5 and up, 2015-2019 : | 74.3% |
| Households with computers, %, 2015-2019 : | 86.8% |
| Percentage of households with a broadband Internet subscription, 2015-2019 : | 80.6% |
| Percentage of people aged 25 and up with a high school diploma or higher, 2015-2019 : | 84.3% |
| Bachelor's degree or higher, proportion of people aged 25 and up, 2015-2019 : | 35.4% |
| Percentage of people under the age of 65 who have a disability, 2015-2019 : | 3.1% |
| Persons under the age of 65 who do not have health insurance, as a percentage : | 12.7% |
| Total civilian labor force, percent of population aged 16 and up, 2015-2019 : | 65.6% |
| Female labor force participation in the civilian labor force, as a percentage of the population aged 16 and up, 2015-2019 : | 57.5% |
| Total sales of lodging and food services in 2012 ($1,000) : | 63,695 |
| Total receipts/revenue for health care and social assistance in 2012 ($1,000) : | 51,151 |
| Manufacturers' total shipments in 2012 ($1,000) : | 2,697 |
| 2012 total retail sales ($1,000) : | 51,940 |
| 2012 total retail sales per capita : | $3,650 |
| Mean commute time to work (in minutes), workers aged 16 and up, 2015-2019 : | 27.1 |
| 2015-2019 median household income (in 2019 dollars) : | $61,795 |
| Income per capita in the previous 12 months (in 2019 dollars), 2015-2019 : | $32,558 |
| Percentage of people living in poverty : | 10.4% |
| Total number of businesses in 2012 : | 2,228 |
| Men-owned businesses in 2012 : | 1,183 |
| Women-owned businesses in 2012 : | 875 |
| Minority-owned businesses in 2012 : | 1,757 |
| Non-minority-owned businesses in 2012 : | 375 |
| Veteran-owned businesses in 2012 : | 130 |
| Nonveteran-owned businesses in 2012 : | 2,068 |
| 2010 population per square mile : | 4,795.4 |
| 2010 land area in square miles : | 2.88 |
| Rate of owner-occupied housing units, 2015-2019 : | 83.5% |
| Owner-occupied housing unit median value, 2015-2019 : | $175,600 |
| From 2015 to 2019, the median selected monthly owner costs - with a mortgage : | $1,407 |
| Monthly owner costs, without a mortgage, at the median, 2015-2019 : | $482 |
| 2015-2019 median gross rent : | $906 |
| 2015-2019 Households : | 2,018 |
| Population per household, 2015-2019 : | 2.95 |
| Living in the same house a year ago, percentage of people aged one year and up, 2015-2019 : | 81.0% |
| Languages other than English spoken at home, as a percentage of people aged 5 and up, 2015-2019 : | 6.7% |
| Households with computers, %, 2015-2019 : | 88.9% |
| Percentage of households with a broadband Internet subscription, 2015-2019 : | 84.7% |
| Percentage of people aged 25 and up with a high school diploma or higher, 2015-2019 : | 93.3% |
| Bachelor's degree or higher, proportion of people aged 25 and up, 2015-2019 : | 28.9% |
| Percentage of people under the age of 65 who have a disability, 2015-2019 : | 7.0% |
| Persons under the age of 65 who do not have health insurance, as a percentage : | 5.3% |
| Total civilian labor force, percent of population aged 16 and up, 2015-2019 : | 67.7% |
| Female labor force participation in the civilian labor force, as a percentage of the population aged 16 and up, 2015-2019 : | 66.3% |
| Total sales of lodging and food services in 2012 ($1,000) : | 21,185 |
| 2012 total retail sales ($1,000) : | 164,229 |
| 2012 total retail sales per capita : | $31,741 |
| Mean commute time to work (in minutes), workers aged 16 and up, 2015-2019 : | 32.4 |
| 2015-2019 median household income (in 2019 dollars) : | $64,846 |
| Income per capita in the previous 12 months (in 2019 dollars), 2015-2019 : | $27,814 |
| Percentage of people living in poverty : | 8.5% |
| Total number of businesses in 2012 : | 783 |
| Men-owned businesses in 2012 : | 348 |
| Women-owned businesses in 2012 : | 317 |
| Minority-owned businesses in 2012 : | 106 |
| Non-minority-owned businesses in 2012 : | 602 |
| Veteran-owned businesses in 2012 : | 106 |
| Nonveteran-owned businesses in 2012 : | 604 |
| 2010 population per square mile : | 92.5 |
| 2010 land area in square miles : | 53.51 |
| Rate of owner-occupied housing units, 2015-2019 : | 77.6% |
| Owner-occupied housing unit median value, 2015-2019 : | $188,700 |
| From 2015 to 2019, the median selected monthly owner costs - with a mortgage : | $1,225 |
| Monthly owner costs, without a mortgage, at the median, 2015-2019 : | $457 |
| 2015-2019 median gross rent : | $1,234 |
| 2015-2019 Households : | 23,560 |
| Population per household, 2015-2019 : | 2.81 |
| Living in the same house a year ago, percentage of people aged one year and up, 2015-2019 : | 87.1% |
| Languages other than English spoken at home, as a percentage of people aged 5 and up, 2015-2019 : | 12.7% |
| Households with computers, %, 2015-2019 : | 93.8% |
| Percentage of households with a broadband Internet subscription, 2015-2019 : | 88.5% |
| Percentage of people aged 25 and up with a high school diploma or higher, 2015-2019 : | 90.5% |
| Bachelor's degree or higher, proportion of people aged 25 and up, 2015-2019 : | 21.8% |
| Percentage of people under the age of 65 who have a disability, 2015-2019 : | 10.6% |
| Persons under the age of 65 who do not have health insurance, as a percentage : | 18.1% |
| Total civilian labor force, percent of population aged 16 and up, 2015-2019 : | 53.2% |
| Female labor force participation in the civilian labor force, as a percentage of the population aged 16 and up, 2015-2019 : | 51.1% |
| Total sales of lodging and food services in 2012 ($1,000) : | 30,877 |
| Total receipts/revenue for health care and social assistance in 2012 ($1,000) : | 62,181 |
| 2012 total retail sales ($1,000) : | 375,321 |
| 2012 total retail sales per capita : | $6,429 |
| Mean commute time to work (in minutes), workers aged 16 and up, 2015-2019 : | 32.5 |
| 2015-2019 median household income (in 2019 dollars) : | $62,097 |
| Income per capita in the previous 12 months (in 2019 dollars), 2015-2019 : | $30,384 |
| Percentage of people living in poverty : | 7.5% |
| Total number of businesses in 2012 : | 3,785 |
| Men-owned businesses in 2012 : | 2,162 |
| Women-owned businesses in 2012 : | 1,191 |
| Minority-owned businesses in 2012 : | 778 |
| Non-minority-owned businesses in 2012 : | 2,798 |
| Veteran-owned businesses in 2012 : | 391 |
| Nonveteran-owned businesses in 2012 : | 3,147 |
| 2010 population per square mile : | 576.0 |
| 2010 land area in square miles : | 99.58 |
| Rate of owner-occupied housing units, 2015-2019 : | 70.7% |
| Owner-occupied housing unit median value, 2015-2019 : | $242,200 |
| From 2015 to 2019, the median selected monthly owner costs - with a mortgage : | $1,676 |
| Monthly owner costs, without a mortgage, at the median, 2015-2019 : | $527 |
| 2015-2019 median gross rent : | $1,441 |
| 2015-2019 Households : | 14,591 |
| Population per household, 2015-2019 : | 3.16 |
| Living in the same house a year ago, percentage of people aged one year and up, 2015-2019 : | 84.1% |
| Languages other than English spoken at home, as a percentage of people aged 5 and up, 2015-2019 : | 31.0% |
| Households with computers, %, 2015-2019 : | 96.0% |
| Percentage of households with a broadband Internet subscription, 2015-2019 : | 91.7% |
| Percentage of people aged 25 and up with a high school diploma or higher, 2015-2019 : | 86.8% |
| Bachelor's degree or higher, proportion of people aged 25 and up, 2015-2019 : | 34.9% |
| Percentage of people under the age of 65 who have a disability, 2015-2019 : | 8.0% |
| Persons under the age of 65 who do not have health insurance, as a percentage : | 14.8% |
| Total civilian labor force, percent of population aged 16 and up, 2015-2019 : | 71.7% |
| Female labor force participation in the civilian labor force, as a percentage of the population aged 16 and up, 2015-2019 : | 65.0% |
| Total sales of lodging and food services in 2012 ($1,000) : | 47,975 |
| Total receipts/revenue for health care and social assistance in 2012 ($1,000) : | 218,770 |
| 2012 total retail sales ($1,000) : | 564,918 |
| 2012 total retail sales per capita : | $14,729 |
| Mean commute time to work (in minutes), workers aged 16 and up, 2015-2019 : | 31.4 |
| 2015-2019 median household income (in 2019 dollars) : | $75,329 |
| Income per capita in the previous 12 months (in 2019 dollars), 2015-2019 : | $30,411 |
| Percentage of people living in poverty : | 9.8% |
| Total number of businesses in 2012 : | 3,903 |
| Men-owned businesses in 2012 : | 2,067 |
| Women-owned businesses in 2012 : | 1,432 |
| Minority-owned businesses in 2012 : | 1,848 |
| Non-minority-owned businesses in 2012 : | 1,811 |
| Veteran-owned businesses in 2012 : | 228 |
| Nonveteran-owned businesses in 2012 : | 3,502 |
| 2010 population per square mile : | 2,418.5 |
| 2010 land area in square miles : | 14.71 |
Best Things to Do in Gardner
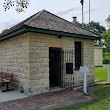
1Two Cell Jail
400 E Mazon St, Gardner, IL 60424, United States View details
Website available
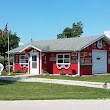
2The Shop On Route 66
315 N Center St, Gardner, IL 60424, United States View details
Phone: +18152370068
Nearby Schools and Colleges
Schools and campuses linked to Gardner, IL. Select a name to open its map and contact details.
| Code | Name | City | ZIP |
|---|---|---|---|
| 146296 | Joliet Junior College | Joliet (IL) | 60431-8938 |
Nearby Transit Stations (21)
Rail and bus stations connected to Gardner, IL. Select a station to open its map and address details.
| Code | Name | Address | Type |
|---|---|---|---|
| DWT | Dwight station | 119 West Main St. | RAIL |
| KKI | Kankakee | 199 South East Ave. | RAIL |
| JOL | Joliet Transportation Center | 50 East Jefferson Street | RAIL |
| PON | Pontiac station | 721 West Washington St. | RAIL |
| GLM | Gilman | US Hwy 24 & West Wenona St. | RAIL |
Closest post offices linked to Gardner.
| Post Office Name | City | ZIP |
|---|---|---|
| Gardner Post Office | Gardner (IL) | 60424 |
Other places with the same name (3)
- Gardner, Massachusetts city in Worcester County, Massachusetts, United States with a population of 20,585 people.
- Gardner, Kansas city in Kansas, United States with a population of 2,941 people.
- Gardner, North Dakota city in North Dakota, United States with a population of 103 people.
Other cities in Grundy County
Cities, towns, neighborhoods & other populated places in Grundy County , IL.
| City Name | Population | Title |
|---|---|---|
| Morris | 15,162 | City in Illinois |
| Aux Sable | 13,493 | Township in Grundy County, Illinois |
| Minooka | 11,456 | City in Illinois, United States of America |
| Coal City | 5,351 | Village in United States of America |
| Diamond | 2,484 | Village in Illinois, USA |
| Wauponsee | 2,329 | Unincorporated community in Illinois |
| Mazon | 1,860 | Village in the United States |
| Braceville | 709 | Township in Grundy County, Illinois |
| South Wilmington | 637 | Human settlement in Illinois, United States of America |
| Nettle Creek | 484 | Township in Grundy County, Illinois |
| Carbon Hill | 334 | Human settlement in Illinois, United States of America |
| Verona | 208 | Village in Illinois, United States |
| East Brooklyn | 104 | Village in Illinois, United States |
| Kinsman | 96 | Village in Illinois, United States |
Distance to Other Cities
Gardner distances to largest Illinois cities