Forrest, Illinois
Forrest: village in Livingston County, Illinois
About
Forrest is a village located in the county of Livingston in the U.S. state of Illinois. Its population at the 2010 census was 1,220 and a population density of 1,821 people per km². After 10 years in 2020 city had an estimated population of 1,124 inhabitants.
The village was created 160 years ago in 1865.

Quick Facts about Forrest
| Population | 1,124 (2020) |
| Country | United States of America |
| State | Illinois (United States) |
| County | Livingston County |
| Postal code | 61741 |
| Plate code | 815 |
| Area | 0.67 km2 |
| Latitude & Longitude | 40.7520,-88.4112 |
| Altitude | 2,241 feet / 683 meters |
| Establishment | January 01, 1866 (160 years ago) |
| Time Zone | America/Chicago |
| Local time | 17:23:08 (1st August 2026) |
| Density | 1,678 Pop. per km² as of 2020 |
| Population growth | -8.54% (2010-2020) |
| Weather | 73℉ Showers And Thunderstorms 7-days weather |

Geography
Forrest is located at 40°45'7"N 88°24'40"W (40.7519800, -88.4111600).
Forrest map
Weather
Showers and thunderstorms. Mostly cloudy, with a high near 73. East northeast wind 5 to 15 mph, with gusts as high as 25 mph. Chance of precipitation...
7-Day ForecastDemographics
According to census records, the population of Forrest decreased by 8.54% in 10 years.
| Year | Population | % Change | Method |
|---|---|---|---|
| 2010 | 1,220 | - | census |
| 2011 | 1,212 | -0.66% | estimation process |
| 2012 | 1,199 | -1.08% | estimation process |
| 2013 | 1,191 | -0.67% | estimation process |
| 2014 | 1,180 | -0.93% | estimation process |
| 2015 | 1,167 | -1.11% | estimation process |
| 2016 | 1,158 | -0.78% | estimation process |
| 2017 | 1,155 | -0.26% | estimation process |
| 2018 | 1,136 | -1.67% | estimation process |
| 2019 | 1,131 | -0.44% | estimation process |
| 2020 | 1,124 | -0.62% | estimation process |
Demographic Facts
| Estimated population as of July 1, 2019 : | 34,839 |
| Based on demographic estimates as of April 1, 2010 : | 33,076 |
| Based on demographic estimates as of 1 April 2010 : | 5.3% |
| April 1, 2020 Population : | 34,613 |
| April 1, 2010 Population : | 33,152 |
| People under 5 years old, percentage : | 6.2% |
| People under 18 years old, percentage : | 19.2% |
| People over 65 (%) : | 16.1% |
| Female persons, % : | 51.3% |
| White only, percent : | 73.5% |
| Black or African American alone, percent : | 2.6% |
| American Indian and Alaska Native only, % : | 0.2% |
| Asians alone % : | 12.3% |
| Only Native Hawaiians and Other Pacific Islanders, % : | 0.8% |
| % of people who have participated in two or more races : | 6.7% |
| % of Hispanic or Latino : | 14.6% |
| White people, not Hispanic or Latino people, make up the majority of the population. : | 64.4% |
| 2015-2019 Veterans : | 1,295 |
| Percentage of foreign-born people, 2015-2019 : | 19.3% |
| Rate of owner-occupied housing units, 2015-2019 : | 65.4% |
Economic Facts
| Rate of owner-occupied housing units, 2015-2019 : | 65.4% |
| Owner-occupied housing unit median value, 2015-2019 : | $716,300 |
| From 2015 to 2019, the median selected monthly owner costs - with a mortgage : | $2,772 |
| Monthly owner costs, without a mortgage, at the median, 2015-2019 : | $671 |
| 2015-2019 median gross rent : | $2,014 |
| 2015-2019 Households : | 13,817 |
| Population per household, 2015-2019 : | 2.49 |
| Living in the same house a year ago, percentage of people aged one year and up, 2015-2019 : | 87.8% |
| Languages other than English spoken at home, as a percentage of people aged 5 and up, 2015-2019 : | 21.9% |
| Households with computers, %, 2015-2019 : | 96.0% |
| Percentage of households with a broadband Internet subscription, 2015-2019 : | 94.1% |
| Percentage of people aged 25 and up with a high school diploma or higher, 2015-2019 : | 96.5% |
| Bachelor's degree or higher, proportion of people aged 25 and up, 2015-2019 : | 55.0% |
| Percentage of people under the age of 65 who have a disability, 2015-2019 : | 6.1% |
| Persons under the age of 65 who do not have health insurance, as a percentage : | 3.8% |
| Total civilian labor force, percent of population aged 16 and up, 2015-2019 : | 65.8% |
| Female labor force participation in the civilian labor force, as a percentage of the population aged 16 and up, 2015-2019 : | 59.7% |
| Total sales of lodging and food services in 2012 ($1,000) : | 106,052 |
| Total receipts/revenue for health care and social assistance in 2012 ($1,000) : | 192,329 |
| 2012 total retail sales ($1,000) : | 607,455 |
| 2012 total retail sales per capita : | $17,956 |
| Mean commute time to work (in minutes), workers aged 16 and up, 2015-2019 : | 34.4 |
| 2015-2019 median household income (in 2019 dollars) : | $118,947 |
| Income per capita in the previous 12 months (in 2019 dollars), 2015-2019 : | $56,660 |
| Percentage of people living in poverty : | 7.8% |
| Total number of businesses in 2012 : | 3,803 |
| Men-owned businesses in 2012 : | 1,796 |
| Women-owned businesses in 2012 : | 1,522 |
| Minority-owned businesses in 2012 : | 1,034 |
| Non-minority-owned businesses in 2012 : | 2,549 |
| Veteran-owned businesses in 2012 : | 248 |
| Nonveteran-owned businesses in 2012 : | 3,299 |
| 2010 population per square mile : | 4,688.1 |
| 2010 land area in square miles : | 7.07 |
Best Things to Do in Forrest
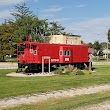
1Forrest, IL Miniature Railroad
303 E Krack St, Forrest, IL 61741, United States View details
Services and Civic Places in Forrest
1Forrest Village City Hall
301 W James St, Forrest, IL 61741 View details
Phone: +18156578226 | Website available
Nearby Schools and Colleges
Schools and campuses linked to Forrest, IL. Select a name to open its map and contact details.
| Code | Name | City | ZIP |
|---|---|---|---|
| 457545 | Paul Mitchell the School-Normal | Normal (IL) | 61761 |
Nearby Transit Stations (18)
Rail and bus stations connected to Forrest, IL. Select a station to open its map and address details.
| Code | Name | Address | Type |
|---|---|---|---|
| PON | Pontiac station | 721 West Washington St. | RAIL |
| GLM | Gilman | US Hwy 24 & West Wenona St. | RAIL |
| DWT | Dwight station | 119 West Main St. | RAIL |
| RTL | Rantoul | West Sangamon and North Kentucky Aves. | RAIL |
| BNL | Uptown Station | 100 East Parkinson St. | RAIL |
Closest post offices linked to Forrest.
| Post Office Name | City | ZIP |
|---|---|---|
| Forr Post Office | Forrest (IL) | 61741 |
| Fairbury Post Office | Fairbury (IL) | 61739 |
| Chatsworth Post Office | Chatsworth (IL) | 60921 |
| Strawn Post Office | Strawn (IL) | 61775 |
| Saunemin Post Office | Saunemin (IL) | 61769 |
Other cities in Livingston County
Cities, towns, neighborhoods & other populated places in Livingston County , IL. (more)
| City Name | Population | Title |
|---|---|---|
| Dwight | 3,984 | Village in Illinois |
| Fairbury | 3,596 | City in Livingston County, Illinois, United States |
| Reading | 1,860 | Township in Livingston County, Illinois |
| Chatsworth | 1,104 | Township in Livingston County, Illinois |
| Flanagan | 1,057 | City in Illinois, United States of America |
| Odell | 957 | Township in Livingston County, Illinois |
| Rooks Creek | 532 | Township in Livingston County, Illinois |
| Cullom | 519 | Human settlement in United States of America |
| Cornell | 451 | Village in Illinois |
| Saunemin | 401 | Township in Livingston County, Illinois |
| Long Point | 257 | Village in the United States |
| Waldo | 239 | Township in Livingston County, Illinois |
| Sunbury | 215 | Township of Illinois |
| Nevada | 215 | Human settlement in United States of America |
| Campus | 157 | Village in Livingston County, Illinois, United States |
| Charlotte | 127 | Unincorporated community in Illinois |
Distance to Other Cities
Forrest distances to largest Illinois cities