Flushing, Ohio
Flushing: human settlement in Belmont County, Ohio, United States of America
About
Flushing is a city located in the county of Belmont in the U.S. state of Ohio. Its population at the 2010 census was 879 and a population density of 553 people per km². After 10 years in 2020 city had an estimated population of 821 inhabitants.
The city was created 177 years ago in 1848.
Quick Facts about Flushing
| Population | 821 (2020) |
| Country | United States of America |
| State | Ohio (United States) |
| County | Belmont County |
| Postal code | 43977 |
| Area | 1.59 km2 |
| Latitude & Longitude | 40.1495,-81.0662 |
| Altitude | 1,283 feet / 391 meters |
| Establishment | January 01, 1849 (177 years ago) |
| Time Zone | America/New_York |
| Local time | 10:45:43 (3rd August 2026) |
| Density | 517 Pop. per km² as of 2020 |
| Population growth | -7.06% (2010-2020) |
| Weather | 80℉ Chance Showers And Thunderstorms 7-days weather |
Geography
Flushing is located at 40°8'58"N 81°3'58"W (40.1495100, -81.0662100).
Flushing map
Weather
A chance of showers and thunderstorms between 7am and 2pm, then a chance of showers and thunderstorms. Mostly cloudy, with a high near 80. Northwest w...
7-Day ForecastDemographics
According to census records, the population of Flushing decreased by 7.06% in 10 years.
| Year | Population | % Change | Method |
|---|---|---|---|
| 2010 | 879 | - | census |
| 2011 | 877 | -0.23% | estimation process |
| 2012 | 871 | -0.69% | estimation process |
| 2013 | 868 | -0.35% | estimation process |
| 2014 | 866 | -0.23% | estimation process |
| 2015 | 860 | -0.7% | estimation process |
| 2016 | 856 | -0.47% | estimation process |
| 2017 | 849 | -0.82% | estimation process |
| 2018 | 840 | -1.07% | estimation process |
| 2019 | 830 | -1.2% | estimation process |
| 2020 | 821 | -1.1% | estimation process |
Demographic Facts
| Estimated population as of July 1, 2019 : | 27,027 |
| Based on demographic estimates as of April 1, 2010 : | 28,466 |
| Based on demographic estimates as of 1 April 2010 : | -5.1% |
| April 1, 2020 Population : | 29,439 |
| April 1, 2010 Population : | 28,448 |
| People under 5 years old, percentage : | 6.0% |
| People under 18 years old, percentage : | 25.5% |
| People over 65 (%) : | 18.4% |
| Female persons, % : | 55.9% |
| White only, percent : | 56.4% |
| Black or African American alone, percent : | 35.2% |
| American Indian and Alaska Native only, % : | 0.2% |
| Asians alone % : | 4.2% |
| Only Native Hawaiians and Other Pacific Islanders, % : | 0.0% |
| % of people who have participated in two or more races : | 3.7% |
| % of Hispanic or Latino : | 2.2% |
| White people, not Hispanic or Latino people, make up the majority of the population. : | 54.6% |
| 2015-2019 Veterans : | 1,098 |
| Percentage of foreign-born people, 2015-2019 : | 7.8% |
| Rate of owner-occupied housing units, 2015-2019 : | 63.1% |
Economic Facts
| Rate of owner-occupied housing units, 2015-2019 : | 63.1% |
| Owner-occupied housing unit median value, 2015-2019 : | $229,500 |
| From 2015 to 2019, the median selected monthly owner costs - with a mortgage : | $2,167 |
| Monthly owner costs, without a mortgage, at the median, 2015-2019 : | $1,103 |
| 2015-2019 median gross rent : | $1,026 |
| 2015-2019 Households : | 11,200 |
| Population per household, 2015-2019 : | 2.43 |
| Living in the same house a year ago, percentage of people aged one year and up, 2015-2019 : | 84.8% |
| Languages other than English spoken at home, as a percentage of people aged 5 and up, 2015-2019 : | 9.9% |
| Households with computers, %, 2015-2019 : | 94.3% |
| Percentage of households with a broadband Internet subscription, 2015-2019 : | 87.8% |
| Percentage of people aged 25 and up with a high school diploma or higher, 2015-2019 : | 97.1% |
| Bachelor's degree or higher, proportion of people aged 25 and up, 2015-2019 : | 66.6% |
| Percentage of people under the age of 65 who have a disability, 2015-2019 : | 6.5% |
| Persons under the age of 65 who do not have health insurance, as a percentage : | 3.7% |
| Total civilian labor force, percent of population aged 16 and up, 2015-2019 : | 66.9% |
| Female labor force participation in the civilian labor force, as a percentage of the population aged 16 and up, 2015-2019 : | 64.3% |
| Total sales of lodging and food services in 2012 ($1,000) : | 19,806 |
| Total receipts/revenue for health care and social assistance in 2012 ($1,000) : | 102,535 |
| 2012 total retail sales ($1,000) : | 109,249 |
| 2012 total retail sales per capita : | $3,896 |
| Mean commute time to work (in minutes), workers aged 16 and up, 2015-2019 : | 23.4 |
| 2015-2019 median household income (in 2019 dollars) : | $87,235 |
| Income per capita in the previous 12 months (in 2019 dollars), 2015-2019 : | $58,970 |
| Percentage of people living in poverty : | 8.5% |
| Total number of businesses in 2012 : | 2,887 |
| Men-owned businesses in 2012 : | 1,389 |
| Women-owned businesses in 2012 : | 1,213 |
| Minority-owned businesses in 2012 : | 869 |
| Non-minority-owned businesses in 2012 : | 1,876 |
| Veteran-owned businesses in 2012 : | 166 |
| Nonveteran-owned businesses in 2012 : | 2,645 |
| 2010 population per square mile : | 4,528.2 |
| 2010 land area in square miles : | 6.28 |
Best Things to Do in Flushing
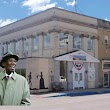
1Underground Railroad Museum
121 E High St, Flushing, OH 43977, United States View details
Phone: +17403913135 | Website available
Services and Civic Places in Flushing
1Flushing City Building
212 E High St, Flushing, OH 43977 View details
Phone: +17409683123
Nearby Schools and Colleges
Schools and campuses linked to Flushing, OH. Select a name to open its map and contact details.
| Code | Name | City | ZIP |
|---|---|---|---|
| 204802 | Ohio University-Eastern Campus | Saint Clairsville (OH) | 43950 |
Nearby Transit Stations (2)
Rail and bus stations connected to Flushing, OH. Select a station to open its map and address details.
| Code | Name | Address | Type |
|---|---|---|---|
| ALC | Alliance | 820 East Main Street | RAIL |
| PGH | Union Station | 1100 Liberty Avenue | RAIL |
Closest post offices linked to Flushing.
| Post Office Name | City | ZIP |
|---|---|---|
| Holloway Post Office | Holloway (OH) | 43985 |
Other places with the same name (1)
- Flushing, Michigan city in Michigan with a population of 7,840 people.
Other cities in Belmont County
Cities, towns, neighborhoods & other populated places in Belmont County , OH. (more)
| City Name | Population | Title |
|---|---|---|
| Colerain | 59,145 | The most populous city in Hamilton County, Ohio. |
| Heath | 11,035 | City in Ohio, USA |
| Martins Ferry | 6,426 | City in Belmont County, Ohio, United States |
| Saint Clairsville | 5,085 | Borough of Pennsylvania |
| Bellaire | 3,957 | Village in Belmont County, Ohio, United States |
| Barnesville | 3,949 | Town in Ohio |
| Shadyside | 3,513 | Village in Belmont County, Ohio, United States of America |
| Farmington | 2,563 | Township in Trumbull County, Ohio |
| Kinsman | 1,748 | Unincorporated community in Trumbull County, Ohio, United States |
| Powhatan Point | 1,502 | Village in the United States |
| Boston | 1,277 | Human settlement in United States of America |
| Bethesda | 1,198 | Village in Belmont County, Ohio USA |
| Yorkville | 996 | Human settlement in Ohio, United States of America |
| Neffs | 993 | Census-designated place in Belmont County, Ohio |
| Brookside | 570 | Human settlement in Belmont County, Ohio, United States of America |
| Holloway | 311 | Village in Ohio |