Farmer City, Illinois
Farmer City: City in De Witt County, Illinois, United States
About
Farmer City is a city located in the county of De Witt in the U.S. state of Illinois. Its population at the 2010 census was 2,037 and a population density of 831 people per km². After 9 years in 2019 city had an estimated population of 1,936 inhabitants.
The city was created 189 years ago in 1836.

Quick Facts about Farmer City
| Population | 1,936 (2019) |
| Country | United States of America |
| State | Illinois (United States) |
| County | De Witt County |
| Postal code | 61842 |
| Plate code | 309 |
| Phone Area Codes | 309 |
| Area | 2.45 km2 |
| Latitude & Longitude | 40.2434,-88.6426 |
| Altitude | 2,369 feet / 722 meters |
| Establishment | January 01, 1837 (189 years ago) |
| Time Zone | America/Chicago |
| Local time | 09:21:16 (17th July 2026) |
| Density | 790 Pop. per km² as of 2019 |
| Population growth | -5.22% (2010-2019) |
| Weather | 87℉ Chance Showers And Thunderstorms 7-days weather |

Geography
Farmer City is located at 40°14'36"N 88°38'33"W (40.2433700, -88.6425700).
Farmer City map
Weather
A chance of showers and thunderstorms. Partly sunny, with a high near 87. West southwest wind 2 to 8 mph. Chance of precipitation is 50%. New rainfall...
7-Day ForecastDemographics
According to census records, the population of Farmer City decreased by 5.22% in 9 years.
| Year | Population | % Change | Method |
|---|---|---|---|
| 2010 | 2,037 | - | census |
| 2011 | 2,020 | -0.84% | estimation process |
| 2012 | 2,017 | -0.15% | estimation process |
| 2013 | 2,005 | -0.6% | estimation process |
| 2014 | 1,988 | -0.86% | estimation process |
| 2015 | 1,989 | 0.05% | estimation process |
| 2016 | 1,989 | 0% | estimation process |
| 2017 | 1,963 | -1.32% | estimation process |
| 2018 | 1,950 | -0.67% | estimation process |
| 2019 | 1,936 | -0.72% | estimation process |
Demographic Facts
| Estimated population as of July 1, 2019 : | 38,546 |
| Based on demographic estimates as of April 1, 2010 : | 37,338 |
| Based on demographic estimates as of 1 April 2010 : | 3.2% |
| April 1, 2020 Population : | 38,640 |
| April 1, 2010 Population : | 37,234 |
| People under 5 years old, percentage : | 6.2% |
| People under 18 years old, percentage : | 19.2% |
| People over 65 (%) : | 17.1% |
| Female persons, % : | 49.5% |
| White only, percent : | 62.9% |
| Black or African American alone, percent : | 2.5% |
| American Indian and Alaska Native only, % : | 0.4% |
| Asians alone % : | 20.7% |
| Only Native Hawaiians and Other Pacific Islanders, % : | 2.0% |
| % of people who have participated in two or more races : | 7.9% |
| % of Hispanic or Latino : | 18.7% |
| White people, not Hispanic or Latino people, make up the majority of the population. : | 52.0% |
| 2015-2019 Veterans : | 1,982 |
| Percentage of foreign-born people, 2015-2019 : | 20.6% |
| Rate of owner-occupied housing units, 2015-2019 : | 70.7% |
Economic Facts
| Rate of owner-occupied housing units, 2015-2019 : | 70.7% |
| Owner-occupied housing unit median value, 2015-2019 : | $882,800 |
| From 2015 to 2019, the median selected monthly owner costs - with a mortgage : | $3,115 |
| Monthly owner costs, without a mortgage, at the median, 2015-2019 : | $605 |
| 2015-2019 median gross rent : | $2,414 |
| 2015-2019 Households : | 13,750 |
| Population per household, 2015-2019 : | 2.82 |
| Living in the same house a year ago, percentage of people aged one year and up, 2015-2019 : | 90.5% |
| Languages other than English spoken at home, as a percentage of people aged 5 and up, 2015-2019 : | 26.2% |
| Households with computers, %, 2015-2019 : | 96.5% |
| Percentage of households with a broadband Internet subscription, 2015-2019 : | 92.8% |
| Percentage of people aged 25 and up with a high school diploma or higher, 2015-2019 : | 95.5% |
| Bachelor's degree or higher, proportion of people aged 25 and up, 2015-2019 : | 45.7% |
| Percentage of people under the age of 65 who have a disability, 2015-2019 : | 5.5% |
| Persons under the age of 65 who do not have health insurance, as a percentage : | 4.0% |
| Total civilian labor force, percent of population aged 16 and up, 2015-2019 : | 68.9% |
| Female labor force participation in the civilian labor force, as a percentage of the population aged 16 and up, 2015-2019 : | 65.9% |
| Total sales of lodging and food services in 2012 ($1,000) : | 43,742 |
| Total receipts/revenue for health care and social assistance in 2012 ($1,000) : | 47,976 |
| 2012 total retail sales ($1,000) : | 194,288 |
| 2012 total retail sales per capita : | $5,088 |
| Mean commute time to work (in minutes), workers aged 16 and up, 2015-2019 : | 32.1 |
| 2015-2019 median household income (in 2019 dollars) : | $125,500 |
| Income per capita in the previous 12 months (in 2019 dollars), 2015-2019 : | $53,104 |
| Percentage of people living in poverty : | 4.6% |
| Total number of businesses in 2012 : | 2,909 |
| Men-owned businesses in 2012 : | 1,405 |
| Women-owned businesses in 2012 : | 1,213 |
| Minority-owned businesses in 2012 : | 1,011 |
| Non-minority-owned businesses in 2012 : | 1,851 |
| Veteran-owned businesses in 2012 : | 236 |
| Nonveteran-owned businesses in 2012 : | 2,604 |
| 2010 population per square mile : | 2,941.5 |
| 2010 land area in square miles : | 12.66 |
| Rate of owner-occupied housing units, 2015-2019 : | 57.3% |
| Owner-occupied housing unit median value, 2015-2019 : | $206,300 |
| From 2015 to 2019, the median selected monthly owner costs - with a mortgage : | $1,922 |
| Monthly owner costs, without a mortgage, at the median, 2015-2019 : | $815 |
| 2015-2019 median gross rent : | $1,087 |
| 2015-2019 Households : | 5,146 |
| Population per household, 2015-2019 : | 2.38 |
| Living in the same house a year ago, percentage of people aged one year and up, 2015-2019 : | 90.7% |
| Languages other than English spoken at home, as a percentage of people aged 5 and up, 2015-2019 : | 25.7% |
| Households with computers, %, 2015-2019 : | 81.5% |
| Percentage of households with a broadband Internet subscription, 2015-2019 : | 75.2% |
| Percentage of people aged 25 and up with a high school diploma or higher, 2015-2019 : | 86.2% |
| Bachelor's degree or higher, proportion of people aged 25 and up, 2015-2019 : | 20.2% |
| Percentage of people under the age of 65 who have a disability, 2015-2019 : | 10.9% |
| Persons under the age of 65 who do not have health insurance, as a percentage : | 7.3% |
| Total civilian labor force, percent of population aged 16 and up, 2015-2019 : | 67.7% |
| Female labor force participation in the civilian labor force, as a percentage of the population aged 16 and up, 2015-2019 : | 61.6% |
| Total sales of lodging and food services in 2012 ($1,000) : | 30,044 |
| Total receipts/revenue for health care and social assistance in 2012 ($1,000) : | 192,226 |
| 2012 total retail sales ($1,000) : | 365,459 |
| 2012 total retail sales per capita : | $28,485 |
| Mean commute time to work (in minutes), workers aged 16 and up, 2015-2019 : | 27.4 |
| 2015-2019 median household income (in 2019 dollars) : | $56,357 |
| Income per capita in the previous 12 months (in 2019 dollars), 2015-2019 : | $31,936 |
| Percentage of people living in poverty : | 13.0% |
| Total number of businesses in 2012 : | 1,160 |
| Men-owned businesses in 2012 : | 614 |
| Women-owned businesses in 2012 : | 428 |
| Minority-owned businesses in 2012 : | 160 |
| Non-minority-owned businesses in 2012 : | 946 |
| Veteran-owned businesses in 2012 : | 134 |
| Nonveteran-owned businesses in 2012 : | 942 |
| 2010 population per square mile : | 2,552.1 |
| 2010 land area in square miles : | 5.06 |
| Rate of owner-occupied housing units, 2015-2019 : | 67.1% |
| Owner-occupied housing unit median value, 2015-2019 : | $153,700 |
| From 2015 to 2019, the median selected monthly owner costs - with a mortgage : | $1,605 |
| Monthly owner costs, without a mortgage, at the median, 2015-2019 : | $770 |
| 2015-2019 median gross rent : | $949 |
| 2015-2019 Households : | 14,471 |
| Population per household, 2015-2019 : | 2.33 |
| Living in the same house a year ago, percentage of people aged one year and up, 2015-2019 : | 87.6% |
| Languages other than English spoken at home, as a percentage of people aged 5 and up, 2015-2019 : | 14.6% |
| Households with computers, %, 2015-2019 : | 88.8% |
| Percentage of households with a broadband Internet subscription, 2015-2019 : | 84.1% |
| Percentage of people aged 25 and up with a high school diploma or higher, 2015-2019 : | 88.7% |
| Bachelor's degree or higher, proportion of people aged 25 and up, 2015-2019 : | 22.7% |
| Percentage of people under the age of 65 who have a disability, 2015-2019 : | 10.1% |
| Persons under the age of 65 who do not have health insurance, as a percentage : | 5.9% |
| Total civilian labor force, percent of population aged 16 and up, 2015-2019 : | 64.6% |
| Female labor force participation in the civilian labor force, as a percentage of the population aged 16 and up, 2015-2019 : | 60.0% |
| Total sales of lodging and food services in 2012 ($1,000) : | 55,079 |
| Total receipts/revenue for health care and social assistance in 2012 ($1,000) : | 359,045 |
| Manufacturers' total shipments in 2012 ($1,000) : | 422,182 |
| 2012 total retail sales ($1,000) : | 931,370 |
| 2012 total retail sales per capita : | $26,010 |
| Mean commute time to work (in minutes), workers aged 16 and up, 2015-2019 : | 26.6 |
| 2015-2019 median household income (in 2019 dollars) : | $63,172 |
| Income per capita in the previous 12 months (in 2019 dollars), 2015-2019 : | $32,881 |
| Percentage of people living in poverty : | 10.3% |
| Total number of businesses in 2012 : | 2,631 |
| Men-owned businesses in 2012 : | 1,500 |
| Women-owned businesses in 2012 : | 831 |
| Minority-owned businesses in 2012 : | 332 |
| Non-minority-owned businesses in 2012 : | 2,121 |
| Veteran-owned businesses in 2012 : | 198 |
| Nonveteran-owned businesses in 2012 : | 2,237 |
| 2010 population per square mile : | 915.2 |
| 2010 land area in square miles : | 39.75 |
Best Things to Do in Farmer City
1Weedman Park
701-799 N John St, Farmer City, IL 61842, United States View details

Services and Civic Places in Farmer City
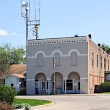
1Farmer City Fireman's Hall
200 E Clinton Ave, Farmer City, IL 61842 View details
Phone: +13099283442
2Farmer City City Hall
105 S Main St, Farmer City, IL 61842 View details
Phone: +13099283412 | Website available
People born in Farmer City (1)
American politician Vespasian Warner was born in Farmer City
Nearby Schools and Colleges
Schools and campuses linked to Farmer City, IL. Select a name to open its map and contact details.
| Code | Name | City | ZIP |
|---|---|---|---|
| 147916 | Parkland College | Champaign (IL) | 61821-1899 |
Nearby Transit Stations (12)
Rail and bus stations connected to Farmer City, IL. Select a station to open its map and address details.
| Code | Name | Address | Type |
|---|---|---|---|
| CHM | Illinois Terminal | 45 East University Ave. | RAIL |
| BNL | Uptown Station | 100 East Parkinson St. | RAIL |
| RTL | Rantoul | West Sangamon and North Kentucky Aves. | RAIL |
| LCN | Lincoln | Broadway and North Chicago Sts. | RAIL |
| PON | Pontiac station | 721 West Washington St. | RAIL |
Closest post offices linked to Farmer City.
| Post Office Name | City | ZIP |
|---|---|---|
| Farmer City Post Office | Farmer City (IL) | 61842 |
Other cities in De Witt County
Cities, towns, neighborhoods & other populated places in De Witt County , IL.
| City Name | Population | Title |
|---|---|---|
| Clinton | 6,733 | Largest city in DeWitt County, Illinois, United States |
| Tunbridge | 716 | Unincorporated community in Illinois |
| Wapella | 510 | Human settlement in Illinois, United States of America |
| Weldon | 404 | Village in DeWitt County, Illinois, United States |
| Waynesville | 402 | Human settlement in Illinois, United States of America |
| Kenney | 310 | Human settlement in Illinois, United States of America |
| De Witt | 175 | City in De Witt County, Illinois, United States |
Distance to Other Cities
Farmer City distances to largest Illinois cities