Bourbonnais, Illinois
Bourbonnais: human settlement in Kankakee County, Illinois, United States of America
About
Bourbonnais is a city located in the county of Kankakee in the U.S. state of Illinois. Its population at the 2010 census was 18,631 and a population density of 760 people per km². After 10 years in 2020 city had an estimated population of 19,378 inhabitants.
The city was created 194 years ago in 1831.

Quick Facts about Bourbonnais
| Population | 19,378 (2020) |
| Country | United States of America |
| State | Illinois (United States) |
| County | Kankakee County |
| Different from | Bourbonais |
| Postal code | 60914 |
| Area | 24.52 km2 |
| Latitude & Longitude | 41.1538,-87.8875 |
| Altitude | 6,601 feet / 2012 meters |
| Establishment | January 01, 1832 (194 years ago) |
| Time Zone | America/Chicago |
| Local time | 17:36:59 (16th July 2026) |
| Density | 790 Pop. per km² as of 2020 |
| Population growth | 3.85% (2010-2020) |
| Weather | 92℉ Mostly Sunny then Chance Showers And Thunderstorms 7-days weather |

Geography
Bourbonnais is located at 41°9'14"N 87°53'15"W (41.1537600, -87.8875400).
Bourbonnais map
Weather
A chance of showers and thunderstorms after 1pm. Mostly sunny, with a high near 92. Heat index values as high as 99. West southwest wind 0 to 5 mph. C...
7-Day ForecastOfficial website of Bourbonnais
Official WebsiteDemographics
The population of Bourbonnais increased by 3.85% in 10 years.
| Year | Population | % Change | Method |
|---|---|---|---|
| 2010 | 18,631 | - | census |
| 2011 | 18,811 | 0.96% | estimation process |
| 2012 | 18,746 | -0.35% | estimation process |
| 2013 | 19,198 | 2.35% | estimation process |
| 2014 | 19,154 | -0.23% | estimation process |
| 2015 | 19,668 | 2.61% | estimation process |
| 2016 | 19,651 | -0.09% | estimation process |
| 2017 | 19,634 | -0.09% | estimation process |
| 2018 | 19,520 | -0.58% | estimation process |
| 2019 | 19,483 | -0.19% | estimation process |
| 2020 | 19,378 | -0.54% | estimation process |
Demographic Facts
| Estimated population as of July 1, 2019 : | 26,941 |
| Based on demographic estimates as of April 1, 2010 : | 25,833 |
| Based on demographic estimates as of 1 April 2010 : | 4.3% |
| April 1, 2020 Population : | 28,335 |
| April 1, 2010 Population : | 25,835 |
| People under 5 years old, percentage : | 5.5% |
| People under 18 years old, percentage : | 23.0% |
| People over 65 (%) : | 16.7% |
| Female persons, % : | 50.3% |
| White only, percent : | 62.2% |
| Black or African American alone, percent : | 1.1% |
| American Indian and Alaska Native only, % : | 0.2% |
| Asians alone % : | 27.5% |
| Only Native Hawaiians and Other Pacific Islanders, % : | 0.9% |
| % of people who have participated in two or more races : | 5.5% |
| % of Hispanic or Latino : | 12.1% |
| White people, not Hispanic or Latino people, make up the majority of the population. : | 53.9% |
| 2015-2019 Veterans : | 798 |
| Percentage of foreign-born people, 2015-2019 : | 30.5% |
| Rate of owner-occupied housing units, 2015-2019 : | 60.8% |
Economic Facts
| Rate of owner-occupied housing units, 2015-2019 : | 60.8% |
| Owner-occupied housing unit median value, 2015-2019 : | $1,527,500 |
| From 2015 to 2019, the median selected monthly owner costs - with a mortgage : | $4,000+ |
| Monthly owner costs, without a mortgage, at the median, 2015-2019 : | $857 |
| 2015-2019 median gross rent : | $2,342 |
| 2015-2019 Households : | 10,285 |
| Population per household, 2015-2019 : | 2.58 |
| Living in the same house a year ago, percentage of people aged one year and up, 2015-2019 : | 86.5% |
| Languages other than English spoken at home, as a percentage of people aged 5 and up, 2015-2019 : | 35.8% |
| Households with computers, %, 2015-2019 : | 95.7% |
| Percentage of households with a broadband Internet subscription, 2015-2019 : | 92.6% |
| Percentage of people aged 25 and up with a high school diploma or higher, 2015-2019 : | 95.7% |
| Bachelor's degree or higher, proportion of people aged 25 and up, 2015-2019 : | 64.7% |
| Percentage of people under the age of 65 who have a disability, 2015-2019 : | 5.0% |
| Persons under the age of 65 who do not have health insurance, as a percentage : | 1.9% |
| Total civilian labor force, percent of population aged 16 and up, 2015-2019 : | 68.6% |
| Female labor force participation in the civilian labor force, as a percentage of the population aged 16 and up, 2015-2019 : | 63.1% |
| Total sales of lodging and food services in 2012 ($1,000) : | 58,035 |
| Total receipts/revenue for health care and social assistance in 2012 ($1,000) : | 34,222 |
| 2012 total retail sales ($1,000) : | 292,341 |
| 2012 total retail sales per capita : | $11,035 |
| Mean commute time to work (in minutes), workers aged 16 and up, 2015-2019 : | 30.3 |
| 2015-2019 median household income (in 2019 dollars) : | $156,052 |
| Income per capita in the previous 12 months (in 2019 dollars), 2015-2019 : | $77,301 |
| Percentage of people living in poverty : | 4.1% |
| Total number of businesses in 2012 : | 3,074 |
| Men-owned businesses in 2012 : | 1,562 |
| Women-owned businesses in 2012 : | 1,044 |
| Minority-owned businesses in 2012 : | 969 |
| Non-minority-owned businesses in 2012 : | 1,965 |
| Veteran-owned businesses in 2012 : | 317 |
| Nonveteran-owned businesses in 2012 : | 2,559 |
| 2010 population per square mile : | 5,590.2 |
| 2010 land area in square miles : | 4.62 |
| Rate of owner-occupied housing units, 2015-2019 : | 51.0% |
| Owner-occupied housing unit median value, 2015-2019 : | $484,400 |
| From 2015 to 2019, the median selected monthly owner costs - with a mortgage : | $2,531 |
| Monthly owner costs, without a mortgage, at the median, 2015-2019 : | $843 |
| 2015-2019 median gross rent : | $1,415 |
| 2015-2019 Households : | 22,549 |
| Population per household, 2015-2019 : | 2.35 |
| Living in the same house a year ago, percentage of people aged one year and up, 2015-2019 : | 83.1% |
| Languages other than English spoken at home, as a percentage of people aged 5 and up, 2015-2019 : | 30.2% |
| Households with computers, %, 2015-2019 : | 93.8% |
| Percentage of households with a broadband Internet subscription, 2015-2019 : | 88.9% |
| Percentage of people aged 25 and up with a high school diploma or higher, 2015-2019 : | 89.1% |
| Bachelor's degree or higher, proportion of people aged 25 and up, 2015-2019 : | 67.4% |
| Percentage of people under the age of 65 who have a disability, 2015-2019 : | 4.0% |
| Persons under the age of 65 who do not have health insurance, as a percentage : | 16.5% |
| Total civilian labor force, percent of population aged 16 and up, 2015-2019 : | 78.6% |
| Female labor force participation in the civilian labor force, as a percentage of the population aged 16 and up, 2015-2019 : | 71.4% |
| 2012 total retail sales per capita : | NA |
| Mean commute time to work (in minutes), workers aged 16 and up, 2015-2019 : | 25.8 |
| 2015-2019 median household income (in 2019 dollars) : | $92,604 |
| Income per capita in the previous 12 months (in 2019 dollars), 2015-2019 : | $60,163 |
| Percentage of people living in poverty : | 11.7% |
| Total number of businesses in 2012 : | F |
| Men-owned businesses in 2012 : | F |
| Women-owned businesses in 2012 : | F |
| Minority-owned businesses in 2012 : | F |
| Non-minority-owned businesses in 2012 : | F |
| Veteran-owned businesses in 2012 : | F |
| Nonveteran-owned businesses in 2012 : | F |
| 2010 population per square mile : | NA |
| 2010 land area in square miles : | NA |
Best Things to Do in Bourbonnais
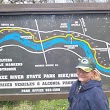
1Kankakee River State Park
5314 IL-102, Bourbonnais, IL 60914, United States View details
Phone: +18159331383 | Website available
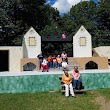
2Perry Farm Park
459 Kennedy Dr, Bourbonnais, IL 60914, United States View details
Phone: +18159339905 | Website available
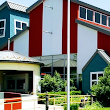
3Exploration Station
1095 Perry St, Bourbonnais, IL 60914, United States View details
Phone: +18159339905 | Website available
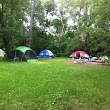
4Davis Creek Campground
County Rd N 224 W, Bourbonnais, IL 60914, United States View details
5Goselin Park
35 Briarcliff Professional Center, Bourbonnais, IL 60914, United States View details

Where to Eat in Bourbonnais
1Steak 'n Shake
1305 Locke Dr, Bourbonnais, IL 60914, United States View details
Phone: +18159325600 | Website available

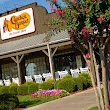
2Cracker Barrel Old Country Store
50 Ken Hayes Dr, Bourbonnais, IL 60914, United States View details
Phone: +18159366022 | Website available
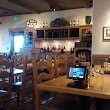
3Olive Garden Italian Restaurant
2048 IL-50, Bourbonnais, IL 60914, United States View details
Phone: +18158020204 | Website available
4Culver's
983 N Convent St, Bourbonnais, IL 60914, United States View details
Phone: +18156143638 | Website available
5Buffalo Wild Wings
2012 N State Rte 50, Bourbonnais, IL 60914, United States View details
Phone: +18159329453 | Website available

Where to Stay in Bourbonnais
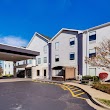
1Hampton Inn Bourbonnais Kankakee
64 Ken Hayes Dr, Bourbonnais, IL 60914, United States View details
Phone: +18159333800 | Website available

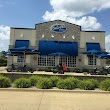
2Best Western Plus Bourbonnais Hotel & Suites
62 Ken Hayes Dr, Bourbonnais, IL 60914, United States View details
Phone: +18159324411 | Website available
People born in Bourbonnais (3)
People born in Bourbonnais, including cleric of Robert II, Count of Artois; founder of the Chartreuse de Val-Saint-Esprit; bishop of Arras Thierry Larchier d'Hirson, French diplomat Jacques de la Brosse, Chirurgeon Gilles Le Vacher, .
More notable people
Nearby Schools and Colleges
Schools and campuses linked to Bourbonnais, IL. Select a name to open its map and contact details.
| Code | Name | City | ZIP |
|---|---|---|---|
| 147828 | Olivet Nazarene University | Bourbonnais (IL) | 60914-2271 |
| 143376 | Paul Mitchell the School-Bradley | Bourbonnais (IL) | 60914 |
| 146348 | Kankakee Community College | Kankakee (IL) | 60901 |
| 145336 | Governors State University | University Park (IL) | 60484 |
| 457031 | Capri Beauty College | New Lenox (IL) | 60451 |
Nearby Transit Stations (25)
Rail and bus stations connected to Bourbonnais, IL. Select a station to open its map and address details.
| Code | Name | Address | Type |
|---|---|---|---|
| KKI | Kankakee | 199 South East Ave. | RAIL |
| GLM | Gilman | US Hwy 24 & West Wenona St. | RAIL |
| JOL | Joliet Transportation Center | 50 East Jefferson Street | RAIL |
| DWT | Dwight station | 119 West Main St. | RAIL |
| DYE | Dyer station | 913 Sheffield Avenue | RAIL |
Closest post offices linked to Bourbonnais.
| Post Office Name | City | ZIP |
|---|---|---|
| Bourbonna Post Office | Bourbonnais (IL) | 60914 |
| Bradley Post Office | Bradley (IL) | 60915 |
| Kankak Post Office | Kankakee (IL) | 60901 |
| Aroma Park Post Office | Aroma Park (IL) | 60910 |
| Manten Post Office | Manteno (IL) | 60950 |
Other cities in Kankakee County
Cities, towns, neighborhoods & other populated places in Kankakee County , IL. (more)
| City Name | Population | Title |
|---|---|---|
| Kankakee | 25,668 | City in Kankakee County, Illinois, United States |
| Bradley | 15,132 | Village in Illinois, United States |
| Manteno | 8,892 | City in Illinois, United States of America |
| Momence | 3,049 | City in Kankakee County, Illinois, United States |
| Otto | 2,445 | Township in Kankakee County, Illinois |
| Herscher | 1,483 | City in Illinois, United States of America |
| Grant Park | 1,231 | Village in Kankakee County, Illinois, United States |
| Saint Anne | 1,174 | Human settlement in Illinois, United States of America |
| Lake | 930 | Township of Illinois |
| Chebanse | 908 | Village in United States of America |
| Aroma Park | 678 | Human settlement in Illinois, United States of America |
| Hopkins Park | 608 | Human settlement in Illinois, United States of America |
| Essex | 548 | Village in Kankakee County, Illinois |
| Sun River Terrace | 488 | Human settlement in Illinois, United States of America |
| Bonfield | 352 | Human settlement in Illinois, United States of America |
| Buckingham | 280 | Town in Illinois, United States |
Distance to Other Cities
Bourbonnais distances to largest Illinois cities