Bostic, North Carolina
Bostic: human settlement in Rutherford County, North Carolina, United States of America
About
Bostic is a city located in the county of Rutherford in the U.S. state of North Carolina. Its population at the 2010 census was 386 and a population density of 160 people per km². After 10 years in 2020 city had an estimated population of 379 inhabitants.
Quick Facts about Bostic
| Population | 379 (2020) |
| Country | United States of America |
| State | North Carolina (United States) |
| County | Rutherford County |
| Postal code | 28018 |
| Phone Area Codes | 828 |
| Area | 2.42 km2 |
| Latitude & Longitude | 35.3626,-81.8357 |
| Altitude | 948 feet / 289 meters |
| Time Zone | America/New_York |
| Local time | 22:14:37 (27th June 2026) |
| Density | 157 Pop. per km² as of 2020 |
| Population growth | -1.85% (2010-2020) |
| Weather | 92℉ Mostly Sunny then Chance Showers And Thunderstorms 7-days weather |
Geography
Bostic is located at 35°21'45"N 81°50'8"W (35.3626200, -81.8356600).
Bostic map
Weather
A chance of showers and thunderstorms after 2pm. Mostly sunny, with a high near 92. Southwest wind 5 to 9 mph. Chance of precipitation is 40%. New rai...
7-Day ForecastDemographics
According to census records, the population of Bostic decreased by 1.85% in 10 years.
| Year | Population | % Change | Method |
|---|---|---|---|
| 2010 | 386 | - | census |
| 2011 | 382 | -1.05% | estimation process |
| 2012 | 381 | -0.26% | estimation process |
| 2013 | 380 | -0.26% | estimation process |
| 2014 | 377 | -0.8% | estimation process |
| 2015 | 376 | -0.27% | estimation process |
| 2016 | 375 | -0.27% | estimation process |
| 2017 | 376 | 0.27% | estimation process |
| 2018 | 378 | 0.53% | estimation process |
| 2019 | 379 | 0.26% | estimation process |
| 2020 | 379 | 0% | estimation process |
Demographic Facts
| Estimated population as of July 1, 2019 : | 6,734 |
| Based on demographic estimates as of April 1, 2010 : | 6,505 |
| Based on demographic estimates as of 1 April 2010 : | 3.5% |
| April 1, 2020 Population : | 6,848 |
| April 1, 2010 Population : | 6,505 |
| People under 5 years old, percentage : | 3.9% |
| People under 18 years old, percentage : | 30.0% |
| People over 65 (%) : | 14.2% |
| Female persons, % : | 55.3% |
| White only, percent : | 85.5% |
| Black or African American alone, percent : | 0.7% |
| American Indian and Alaska Native only, % : | 0.0% |
| Asians alone % : | 11.0% |
| Only Native Hawaiians and Other Pacific Islanders, % : | 0.0% |
| % of people who have participated in two or more races : | 2.8% |
| % of Hispanic or Latino : | 2.6% |
| White people, not Hispanic or Latino people, make up the majority of the population. : | 82.9% |
| 2015-2019 Veterans : | 181 |
| Percentage of foreign-born people, 2015-2019 : | 11.0% |
| Rate of owner-occupied housing units, 2015-2019 : | 83.6% |
Economic Facts
| Rate of owner-occupied housing units, 2015-2019 : | 83.6% |
| Owner-occupied housing unit median value, 2015-2019 : | $757,000 |
| From 2015 to 2019, the median selected monthly owner costs - with a mortgage : | $3,956 |
| Monthly owner costs, without a mortgage, at the median, 2015-2019 : | $1,500+ |
| 2015-2019 median gross rent : | $1,919 |
| 2015-2019 Households : | 2,210 |
| Population per household, 2015-2019 : | 3.02 |
| Living in the same house a year ago, percentage of people aged one year and up, 2015-2019 : | 91.9% |
| Languages other than English spoken at home, as a percentage of people aged 5 and up, 2015-2019 : | 16.9% |
| Households with computers, %, 2015-2019 : | 93.0% |
| Percentage of households with a broadband Internet subscription, 2015-2019 : | 94.8% |
| Percentage of people aged 25 and up with a high school diploma or higher, 2015-2019 : | 98.2% |
| Bachelor's degree or higher, proportion of people aged 25 and up, 2015-2019 : | 73.7% |
| Percentage of people under the age of 65 who have a disability, 2015-2019 : | 2.9% |
| Persons under the age of 65 who do not have health insurance, as a percentage : | 1.9% |
| Total civilian labor force, percent of population aged 16 and up, 2015-2019 : | 63.5% |
| Female labor force participation in the civilian labor force, as a percentage of the population aged 16 and up, 2015-2019 : | 52.4% |
| Total sales of lodging and food services in 2012 ($1,000) : | 21,989 |
| Total receipts/revenue for health care and social assistance in 2012 ($1,000) : | 34,828 |
| Manufacturers' total shipments in 2012 ($1,000) : | 2,572 |
| 2012 total retail sales ($1,000) : | 57,580 |
| 2012 total retail sales per capita : | $8,650 |
| Mean commute time to work (in minutes), workers aged 16 and up, 2015-2019 : | 34.2 |
| 2015-2019 median household income (in 2019 dollars) : | $170,968 |
| Income per capita in the previous 12 months (in 2019 dollars), 2015-2019 : | $82,388 |
| Percentage of people living in poverty : | 1.6% |
| Total number of businesses in 2012 : | 659 |
| Men-owned businesses in 2012 : | 339 |
| Women-owned businesses in 2012 : | 261 |
| Minority-owned businesses in 2012 : | 85 |
| Non-minority-owned businesses in 2012 : | 543 |
| Veteran-owned businesses in 2012 : | F |
| Nonveteran-owned businesses in 2012 : | 607 |
| 2010 population per square mile : | 2,100.7 |
| 2010 land area in square miles : | 3.10 |
Best Things to Do in Bostic
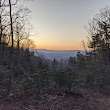
1South Mountains Game Lands
Bostic, NC 28018, United States View details
Phone: +19197070150 | Website available
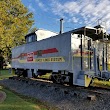
2The Bostic Lincoln Center
112 Depot St, Bostic, NC 28018, United States View details
Phone: +18282459800 | Website available
Where to Stay in Bostic
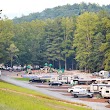
1Yogi Bear’s Jellystone Park™ Camp-Resort: Golden Valley, NC
182 Jellystone Pkwy, Bostic, NC 28018, United States View details
Phone: +18284170086 | Website available
Services and Civic Places in Bostic
1Bostic Town Hall
104 Pearidge Rd, Bostic, NC 28018 View details
Phone: +18282455108 | Website available

People born in Bostic (1)
American historian Burl Noggle was born in Bostic
Nearby Schools and Colleges
Schools and campuses linked to Bostic, NC. Select a name to open its map and contact details.
| Code | Name | City | ZIP |
|---|---|---|---|
| 198710 | Isothermal Community College | Spindale (NC) | 28160-0804 |
Nearby Transit Stations (6)
Rail and bus stations connected to Bostic, NC. Select a station to open its map and address details.
| Code | Name | Address | Type |
|---|---|---|---|
| SPB | Spartanburg | 290 Magnolia St | RAIL |
| GAS | Gastonia | 350 Hancock Street | RAIL |
| GRV | Greenville | 1120 West Washington Street | RAIL |
| CLT | Charlotte | 1914 North Tryon St. | RAIL |
| KAN | Kannapolis | 201 South Main St. | RAIL |
Closest post offices linked to Bostic.
| Post Office Name | City | ZIP |
|---|---|---|
| B Post Office | Bostic (NC) | 28018 |
Other cities in Rutherford County
Cities, towns, neighborhoods & other populated places in Rutherford County , NC.
| City Name | Population | Title |
|---|---|---|
| Forest City | 7,138 | Town in Rutherford County, North Carolina, United States |
| Spindale | 4,175 | City in Rutherford County, North Carolina, United States of America |
| Rutherfordton | 4,090 | Town in Rutherford County, North Carolina, United States |
| Lake Lure | 1,153 | Town in North Carolina |
| Ellenboro | 830 | Human settlement in Rutherford County, North Carolina, United States of America |
| Ruth | 400 | Town in North Carolina, United States |