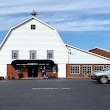
Borden, Indiana
Borden: town in Indiana
About
Borden is a town located in the county of Clark in the U.S. state of Indiana. Its population at the 2010 census was 808 and a population density of 581 people per km². After 10 years in 2020 city had an estimated population of 930 inhabitants.
The town was created 210 years ago in 1815.
Quick Facts about Borden
| Population | 930 (2020) |
| Country | United States of America |
| State | Indiana (United States) |
| County | Clark County |
| Postal code | 47106 |
| Phone Area Codes | 812 |
| Area | 1.39 km2 |
| Latitude & Longitude | 38.4667,-85.9458 |
| Altitude | 561 feet / 171 meters |
| Establishment | January 01, 1816 (210 years ago) |
| Time Zone | America/Kentucky/Louisville |
| Local time | 01:13:21 (27th June 2026) |
| Density | 669 Pop. per km² as of 2020 |
| Population growth | 13.12% (2010-2020) |
| Weather | 68℉ Showers And Thunderstorms then Chance Showers And Thunderstorms 7-days weather |
Geography
Borden is located at 38°28'0"N 85°56'45"W (38.4667300, -85.9458000).
Borden map
Weather
Showers and thunderstorms before midnight, then a chance of showers and thunderstorms between midnight and 3am, then showers and thunderstorms likely....
7-Day ForecastOfficial website of Borden
Official WebsiteDemographics
The population of Borden increased by 13.12% in 10 years.
| Year | Population | % Change | Method |
|---|---|---|---|
| 2010 | 808 | - | census |
| 2011 | 836 | 3.35% | estimation process |
| 2012 | 847 | 1.3% | estimation process |
| 2013 | 866 | 2.19% | estimation process |
| 2014 | 882 | 1.81% | estimation process |
| 2015 | 894 | 1.34% | estimation process |
| 2016 | 907 | 1.43% | estimation process |
| 2017 | 919 | 1.31% | estimation process |
| 2018 | 930 | 1.18% | estimation process |
| 2019 | 936 | 0.64% | estimation process |
| 2020 | 930 | -0.65% | estimation process |
Demographic Facts
| Estimated population as of July 1, 2019 : | 21,210 |
| Based on demographic estimates as of April 1, 2010 : | 21,981 |
| Based on demographic estimates as of 1 April 2010 : | -3.5% |
| April 1, 2020 Population : | 21,687 |
| April 1, 2010 Population : | 21,975 |
| People under 5 years old, percentage : | 4.1% |
| People under 18 years old, percentage : | 23.8% |
| People over 65 (%) : | 14.7% |
| Female persons, % : | 53.1% |
| White only, percent : | 27.2% |
| Black or African American alone, percent : | 66.4% |
| American Indian and Alaska Native only, % : | 0.0% |
| Asians alone % : | 0.5% |
| Only Native Hawaiians and Other Pacific Islanders, % : | 0.0% |
| % of people who have participated in two or more races : | 2.8% |
| % of Hispanic or Latino : | 4.6% |
| White people, not Hispanic or Latino people, make up the majority of the population. : | 25.0% |
| 2015-2019 Veterans : | 871 |
| Percentage of foreign-born people, 2015-2019 : | 3.7% |
| Rate of owner-occupied housing units, 2015-2019 : | 59.9% |
Economic Facts
| Rate of owner-occupied housing units, 2015-2019 : | 59.9% |
| Owner-occupied housing unit median value, 2015-2019 : | $73,600 |
| From 2015 to 2019, the median selected monthly owner costs - with a mortgage : | $1,346 |
| Monthly owner costs, without a mortgage, at the median, 2015-2019 : | $484 |
| 2015-2019 median gross rent : | $1,211 |
| 2015-2019 Households : | 8,590 |
| Population per household, 2015-2019 : | 2.43 |
| Living in the same house a year ago, percentage of people aged one year and up, 2015-2019 : | 91.1% |
| Languages other than English spoken at home, as a percentage of people aged 5 and up, 2015-2019 : | 5.3% |
| Households with computers, %, 2015-2019 : | 91.6% |
| Percentage of households with a broadband Internet subscription, 2015-2019 : | 82.8% |
| Percentage of people aged 25 and up with a high school diploma or higher, 2015-2019 : | 93.9% |
| Bachelor's degree or higher, proportion of people aged 25 and up, 2015-2019 : | 26.4% |
| Percentage of people under the age of 65 who have a disability, 2015-2019 : | 10.7% |
| Persons under the age of 65 who do not have health insurance, as a percentage : | 5.5% |
| Total civilian labor force, percent of population aged 16 and up, 2015-2019 : | 63.2% |
| Female labor force participation in the civilian labor force, as a percentage of the population aged 16 and up, 2015-2019 : | 62.4% |
| Total sales of lodging and food services in 2012 ($1,000) : | 5,219 |
| Total receipts/revenue for health care and social assistance in 2012 ($1,000) : | 24,742 |
| 2012 total retail sales ($1,000) : | 26,986 |
| 2012 total retail sales per capita : | $1,225 |
| Mean commute time to work (in minutes), workers aged 16 and up, 2015-2019 : | 31.9 |
| 2015-2019 median household income (in 2019 dollars) : | $53,938 |
| Income per capita in the previous 12 months (in 2019 dollars), 2015-2019 : | $25,957 |
| Percentage of people living in poverty : | 13.4% |
| Total number of businesses in 2012 : | 1,695 |
| Men-owned businesses in 2012 : | 704 |
| Women-owned businesses in 2012 : | 880 |
| Minority-owned businesses in 2012 : | 1,156 |
| Non-minority-owned businesses in 2012 : | 488 |
| Veteran-owned businesses in 2012 : | 123 |
| Nonveteran-owned businesses in 2012 : | 1,517 |
| 2010 population per square mile : | 4,428.7 |
| 2010 land area in square miles : | 4.96 |
Best Things to Do in Borden
1Deam Lake State Recreation Area
1217 Deam Lake Rd, Borden, IN 47106, United States View details
Phone: +18122465421 | Website available

2Huber's Orchard and Winery
19816 Huber Rd, Borden, IN 47106, United States View details
Phone: +18129239463 | Website available
Where to Eat in Borden
1Hubers Joe Family Farm & Restaurant
2421 Engle Rd, Borden, IN 47106, United States View details
Phone: +18129235255 | Website available

People born in Borden (3)
People born in Borden, including football player Marv Wood, baseball player Odie Porter, journalist, minister, and politician James T. White, .
More notable people
Nearby Schools and Colleges
Schools and campuses linked to Borden, IN. Select a name to open its map and contact details.
| Code | Name | City | ZIP |
|---|---|---|---|
| 151379 | Indiana University-Southeast | New Albany (IN) | 47150 |
Nearby Transit Stations (1)
Rail and bus stations connected to Borden, IN. Select a station to open its map and address details.
| Code | Name | Address | Type |
|---|---|---|---|
| LVL | Louisville, Kentucky | 720 West Muhammad Ali Blvd. | BUS |
Closest post offices linked to Borden.
| Post Office Name | City | ZIP |
|---|---|---|
| Borden Post Office | Borden (IN) | 47106 |
Other cities in Clark County
Cities, towns, neighborhoods & other populated places in Clark County , IN.
| City Name | Population | Title |
|---|---|---|
| Jeffersonville | 48,530 | The most populous city in Clark County, Indiana. |
| Clarksville | 21,447 | Town in Clark County, Indiana, United States |
| Sellersburg | 9,047 | City in Clark County, Indiana, United States of America |
| Charlestown | 8,544 | City in Clark County, Indiana, United States |
| Henryville | 1,905 | Census-designated place in Clark County, Indiana |
| Utica | 996 | Town in Indiana, United States |
| Owen | 664 | City in Clark County, Wisconsin |
| New Market | 622 | Town in Montgomery County, Indiana, United States |
| Bethlehem | 357 | Town |