Adena, Ohio
Adena: village in Ohio, USA
About
Adena is a village located in the county of Jefferson in the U.S. state of Ohio. Its population at the 2010 census was 759 and a population density of 546 people per km². After 10 years in 2020 city had an estimated population of 699 inhabitants.
Quick Facts about Adena
| Population | 699 (2020) |
| Country | United States of America |
| State | Ohio (United States) |
| County | Jefferson County |
| Different from | Adena culture |
| Postal code | 43901 |
| Area | 1.39 km2 |
| Latitude & Longitude | 40.2187,-80.8729 |
| Named for | Adena Mansion |
| Altitude | 863 feet / 263 meters |
| Time Zone | Eastern Time Zone |
| Local time | 09:53:16 (3rd August 2026) |
| Density | 502 Pop. per km² as of 2020 |
| Population growth | -8.58% (2010-2020) |
| Weather | 81℉ Chance Showers And Thunderstorms 7-days weather |
Geography
Adena is located at 40°13'7"N 80°52'22"W (40.2186800, -80.8728700).
Adena map
Weather
A chance of showers and thunderstorms after 7am. Mostly cloudy, with a high near 81. Northwest wind around 6 mph. Chance of precipitation is 50%. New...
7-Day ForecastDemographics
According to census records, the population of Adena decreased by 8.58% in 10 years.
| Year | Population | % Change | Method |
|---|---|---|---|
| 2010 | 759 | - | census |
| 2011 | 751 | -1.07% | estimation process |
| 2012 | 743 | -1.08% | estimation process |
| 2013 | 741 | -0.27% | estimation process |
| 2014 | 734 | -0.95% | estimation process |
| 2015 | 730 | -0.55% | estimation process |
| 2016 | 723 | -0.97% | estimation process |
| 2017 | 715 | -1.12% | estimation process |
| 2018 | 710 | -0.7% | estimation process |
| 2019 | 704 | -0.85% | estimation process |
| 2020 | 699 | -0.72% | estimation process |
Demographic Facts
| Estimated population as of July 1, 2019 : | 29,058 |
| Based on demographic estimates as of April 1, 2010 : | 31,161 |
| Based on demographic estimates as of 1 April 2010 : | -6.7% |
| April 1, 2020 Population : | 28,712 |
| April 1, 2010 Population : | 31,146 |
| People under 5 years old, percentage : | 6.8% |
| People under 18 years old, percentage : | 24.0% |
| People over 65 (%) : | 16.6% |
| Female persons, % : | 51.7% |
| White only, percent : | 87.0% |
| Black or African American alone, percent : | 4.4% |
| American Indian and Alaska Native only, % : | 0.2% |
| Asians alone % : | 0.5% |
| Only Native Hawaiians and Other Pacific Islanders, % : | 0.1% |
| % of people who have participated in two or more races : | 3.6% |
| % of Hispanic or Latino : | 9.9% |
| White people, not Hispanic or Latino people, make up the majority of the population. : | 81.9% |
| 2015-2019 Veterans : | 1,698 |
| Percentage of foreign-born people, 2015-2019 : | 1.9% |
| Rate of owner-occupied housing units, 2015-2019 : | 49.7% |
Economic Facts
| Rate of owner-occupied housing units, 2015-2019 : | 49.7% |
| Owner-occupied housing unit median value, 2015-2019 : | $63,200 |
| From 2015 to 2019, the median selected monthly owner costs - with a mortgage : | $840 |
| Monthly owner costs, without a mortgage, at the median, 2015-2019 : | $396 |
| 2015-2019 median gross rent : | $616 |
| 2015-2019 Households : | 12,659 |
| Population per household, 2015-2019 : | 2.27 |
| Living in the same house a year ago, percentage of people aged one year and up, 2015-2019 : | 85.8% |
| Languages other than English spoken at home, as a percentage of people aged 5 and up, 2015-2019 : | 8.6% |
| Households with computers, %, 2015-2019 : | 84.9% |
| Percentage of households with a broadband Internet subscription, 2015-2019 : | 74.5% |
| Percentage of people aged 25 and up with a high school diploma or higher, 2015-2019 : | 85.7% |
| Bachelor's degree or higher, proportion of people aged 25 and up, 2015-2019 : | 16.9% |
| Percentage of people under the age of 65 who have a disability, 2015-2019 : | 16.9% |
| Persons under the age of 65 who do not have health insurance, as a percentage : | 6.0% |
| Total civilian labor force, percent of population aged 16 and up, 2015-2019 : | 56.8% |
| Female labor force participation in the civilian labor force, as a percentage of the population aged 16 and up, 2015-2019 : | 53.8% |
| Total sales of lodging and food services in 2012 ($1,000) : | 36,984 |
| Total receipts/revenue for health care and social assistance in 2012 ($1,000) : | 305,865 |
| Manufacturers' total shipments in 2012 ($1,000) : | 251,310 |
| 2012 total retail sales ($1,000) : | 391,501 |
| 2012 total retail sales per capita : | $12,725 |
| Mean commute time to work (in minutes), workers aged 16 and up, 2015-2019 : | 14.6 |
| 2015-2019 median household income (in 2019 dollars) : | $33,420 |
| Income per capita in the previous 12 months (in 2019 dollars), 2015-2019 : | $20,321 |
| Percentage of people living in poverty : | 29.5% |
| Total number of businesses in 2012 : | 1,663 |
| Men-owned businesses in 2012 : | 988 |
| Women-owned businesses in 2012 : | 474 |
| Minority-owned businesses in 2012 : | 98 |
| Non-minority-owned businesses in 2012 : | 1,430 |
| Veteran-owned businesses in 2012 : | 135 |
| Nonveteran-owned businesses in 2012 : | 1,372 |
| 2010 population per square mile : | 3,486.0 |
| 2010 land area in square miles : | 8.93 |
| Rate of owner-occupied housing units, 2015-2019 : | 47.1% |
| Owner-occupied housing unit median value, 2015-2019 : | $109,800 |
| From 2015 to 2019, the median selected monthly owner costs - with a mortgage : | $1,163 |
| Monthly owner costs, without a mortgage, at the median, 2015-2019 : | $452 |
| 2015-2019 median gross rent : | $694 |
| 2015-2019 Households : | 7,142 |
| Population per household, 2015-2019 : | 2.72 |
| Living in the same house a year ago, percentage of people aged one year and up, 2015-2019 : | 88.0% |
| Languages other than English spoken at home, as a percentage of people aged 5 and up, 2015-2019 : | 10.7% |
| Households with computers, %, 2015-2019 : | 81.3% |
| Percentage of households with a broadband Internet subscription, 2015-2019 : | 66.0% |
| Percentage of people aged 25 and up with a high school diploma or higher, 2015-2019 : | 79.6% |
| Bachelor's degree or higher, proportion of people aged 25 and up, 2015-2019 : | 20.1% |
| Percentage of people under the age of 65 who have a disability, 2015-2019 : | 9.7% |
| Persons under the age of 65 who do not have health insurance, as a percentage : | 15.4% |
| Total civilian labor force, percent of population aged 16 and up, 2015-2019 : | 47.8% |
| Female labor force participation in the civilian labor force, as a percentage of the population aged 16 and up, 2015-2019 : | 46.0% |
| Total sales of lodging and food services in 2012 ($1,000) : | 92,598 |
| Total receipts/revenue for health care and social assistance in 2012 ($1,000) : | 444,883 |
| Manufacturers' total shipments in 2012 ($1,000) : | 727,868 |
| 2012 total retail sales ($1,000) : | 938,127 |
| 2012 total retail sales per capita : | $43,097 |
| Mean commute time to work (in minutes), workers aged 16 and up, 2015-2019 : | 19.2 |
| 2015-2019 median household income (in 2019 dollars) : | $36,935 |
| Income per capita in the previous 12 months (in 2019 dollars), 2015-2019 : | $20,108 |
| Percentage of people living in poverty : | 32.4% |
| Total number of businesses in 2012 : | 2,366 |
| Men-owned businesses in 2012 : | 1,026 |
| Women-owned businesses in 2012 : | 1,124 |
| Minority-owned businesses in 2012 : | 955 |
| Non-minority-owned businesses in 2012 : | 1,221 |
| Veteran-owned businesses in 2012 : | 354 |
| Nonveteran-owned businesses in 2012 : | 1,795 |
| 2010 population per square mile : | 1,203.9 |
| 2010 land area in square miles : | 17.89 |
| Rate of owner-occupied housing units, 2015-2019 : | 51.2% |
| Owner-occupied housing unit median value, 2015-2019 : | $225,200 |
| From 2015 to 2019, the median selected monthly owner costs - with a mortgage : | $1,468 |
| Monthly owner costs, without a mortgage, at the median, 2015-2019 : | $482 |
| 2015-2019 median gross rent : | $863 |
| 2015-2019 Households : | 4,428 |
| Population per household, 2015-2019 : | 2.08 |
| Living in the same house a year ago, percentage of people aged one year and up, 2015-2019 : | 78.6% |
| Languages other than English spoken at home, as a percentage of people aged 5 and up, 2015-2019 : | 8.7% |
| Households with computers, %, 2015-2019 : | 87.1% |
| Percentage of households with a broadband Internet subscription, 2015-2019 : | 79.2% |
| Percentage of people aged 25 and up with a high school diploma or higher, 2015-2019 : | 91.3% |
| Bachelor's degree or higher, proportion of people aged 25 and up, 2015-2019 : | 35.2% |
| Percentage of people under the age of 65 who have a disability, 2015-2019 : | 14.7% |
| Persons under the age of 65 who do not have health insurance, as a percentage : | 13.4% |
| Total civilian labor force, percent of population aged 16 and up, 2015-2019 : | 57.6% |
| Female labor force participation in the civilian labor force, as a percentage of the population aged 16 and up, 2015-2019 : | 52.0% |
| Total sales of lodging and food services in 2012 ($1,000) : | 77,703 |
| Total receipts/revenue for health care and social assistance in 2012 ($1,000) : | 247,064 |
| 2012 total retail sales ($1,000) : | 514,026 |
| 2012 total retail sales per capita : | $56,849 |
| Mean commute time to work (in minutes), workers aged 16 and up, 2015-2019 : | 16.9 |
| 2015-2019 median household income (in 2019 dollars) : | $42,985 |
| Income per capita in the previous 12 months (in 2019 dollars), 2015-2019 : | $33,780 |
| Percentage of people living in poverty : | 16.3% |
| Total number of businesses in 2012 : | 1,787 |
| Men-owned businesses in 2012 : | 991 |
| Women-owned businesses in 2012 : | 376 |
| Minority-owned businesses in 2012 : | 178 |
| Non-minority-owned businesses in 2012 : | 1,454 |
| Veteran-owned businesses in 2012 : | 329 |
| Nonveteran-owned businesses in 2012 : | 1,215 |
| 2010 population per square mile : | 1,264.2 |
| 2010 land area in square miles : | 6.85 |
Best Things to Do in Adena
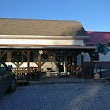
1Black Sheep Vineyard Inc.
1454 US-250 #7959, Adena, OH 43901, United States View details
Phone: +17405463741 | Website available
People born in Adena (2)
People born in Adena, including politician Jerry W. Krupinski, football player Jim Moscrip, .
More notable people
Nearby Schools and Colleges
Schools and campuses linked to Adena, OH. Select a name to open its map and contact details.
| Code | Name | City | ZIP |
|---|---|---|---|
| 201283 | Belmont College | St Clairsville (OH) | 43950 |
Nearby Transit Stations (4)
Rail and bus stations connected to Adena, OH. Select a station to open its map and address details.
| Code | Name | Address | Type |
|---|---|---|---|
| PGH | Union Station | 1100 Liberty Avenue | RAIL |
| ALC | Alliance | 820 East Main Street | RAIL |
| COV | Connellsville station | North Water Street and West Peach Street | RAIL |
| GNB | Greensburg | Harrison Ave. and Seton Hill Dr. | RAIL |
Closest post offices linked to Adena.
| Post Office Name | City | ZIP |
|---|---|---|
| Adena Post Office | Adena (OH) | 43901 |
Other cities in Jefferson County
Cities, towns, neighborhoods & other populated places in Jefferson County , OH. (more)
| City Name | Population | Title |
|---|---|---|
| Steubenville | 17,586 | City in and county seat of Jefferson County, Ohio, United States |
| Island Creek | 9,832 | Township in Jefferson County, Ohio |
| Toronto | 4,902 | City in Jefferson County, Ohio, United States |
| Wintersville | 3,645 | City in Jefferson County, Ohio, United States of America |
| Mingo Junction | 3,185 | Town |
| Yellow Creek | 1,995 | Unincorporated community in Ohio, United States |
| Brilliant | 1,482 | Census-designated place in Ohio |
| Tiltonsville | 1,274 | City in Jefferson County, Ohio, United States of America |
| Smithfield | 786 | City in Jefferson County, Ohio, United States of America |
| Bergholz | 613 | Town |
| York | 475 | City in United States of America |
| Richmond | 443 | Place in Ohio, United States of America |
| Rayland | 388 | Village in Jefferson County, Ohio |
| Irondale | 355 | Human settlement in Jefferson County, Ohio, United States of America |
| Empire | 279 | Village in Jefferson County, Ohio, United States |
| Stratton | 278 | Human settlement in Jefferson County, Ohio, United States of America |