Rossville, Indiana
Rossville: human settlement in Clinton County, Indiana, United States of America
About
Rossville is a city located in the county of Clinton in the U.S. state of Indiana. Its population at the 2010 census was 1,653 and a population density of 1,216 people per km². After 10 years in 2020 city had an estimated population of 1,540 inhabitants.
The city was created 194 years ago in 1831.

Quick Facts about Rossville
| Population | 1,540 (2020) |
| Country | United States of America |
| State | Indiana (United States) |
| County | Clinton County |
| Postal code | 46065 |
| Phone Area Codes | 765 |
| Area | 1.36 km2 |
| Latitude & Longitude | 40.4170,-86.5947 |
| Altitude | 725 feet / 221 meters |
| Establishment | January 01, 1832 (194 years ago) |
| Time Zone | America/Indiana/Indianapolis |
| Local time | 23:14:51 (14th July 2026) |
| Density | 1,133 Pop. per km² as of 2020 |
| Population growth | -7.34% (2010-2020) |

Geography
Rossville is located at 40°25'1"N 86°35'41"W (40.4169800, -86.5947200).
Rossville map
Demographics
According to census records, the population of Rossville decreased by 7.34% in 10 years.
| Year | Population | % Change | Method |
|---|---|---|---|
| 2010 | 1,653 | - | census |
| 2011 | 1,558 | -6.1% | estimation process |
| 2012 | 1,552 | -0.39% | estimation process |
| 2013 | 1,549 | -0.19% | estimation process |
| 2014 | 1,539 | -0.65% | estimation process |
| 2015 | 1,537 | -0.13% | estimation process |
| 2016 | 1,532 | -0.33% | estimation process |
| 2017 | 1,536 | 0.26% | estimation process |
| 2018 | 1,532 | -0.26% | estimation process |
| 2019 | 1,545 | 0.84% | estimation process |
| 2020 | 1,540 | -0.32% | estimation process |
Demographic Facts
| Estimated population as of July 1, 2019 : | 8,421 |
| Based on demographic estimates as of April 1, 2010 : | 8,349 |
| Based on demographic estimates as of 1 April 2010 : | 0.9% |
| April 1, 2020 Population : | 8,466 |
| April 1, 2010 Population : | 8,283 |
| People under 5 years old, percentage : | 6.3% |
| People under 18 years old, percentage : | 26.7% |
| People over 65 (%) : | 16.1% |
| Female persons, % : | 50.2% |
| White only, percent : | 83.2% |
| Black or African American alone, percent : | 2.5% |
| American Indian and Alaska Native only, % : | 0.7% |
| Asians alone % : | 0.5% |
| Only Native Hawaiians and Other Pacific Islanders, % : | 0.2% |
| % of people who have participated in two or more races : | 2.7% |
| % of Hispanic or Latino : | 75.1% |
| White people, not Hispanic or Latino people, make up the majority of the population. : | 19.8% |
| 2015-2019 Veterans : | 354 |
| Percentage of foreign-born people, 2015-2019 : | 13.8% |
| Rate of owner-occupied housing units, 2015-2019 : | 66.3% |
Economic Facts
| Rate of owner-occupied housing units, 2015-2019 : | 66.3% |
| Owner-occupied housing unit median value, 2015-2019 : | $96,100 |
| From 2015 to 2019, the median selected monthly owner costs - with a mortgage : | $1,217 |
| Monthly owner costs, without a mortgage, at the median, 2015-2019 : | $376 |
| 2015-2019 median gross rent : | $829 |
| 2015-2019 Households : | 2,771 |
| Population per household, 2015-2019 : | 2.80 |
| Living in the same house a year ago, percentage of people aged one year and up, 2015-2019 : | 87.4% |
| Languages other than English spoken at home, as a percentage of people aged 5 and up, 2015-2019 : | 53.8% |
| Households with computers, %, 2015-2019 : | 80.3% |
| Percentage of households with a broadband Internet subscription, 2015-2019 : | 63.6% |
| Percentage of people aged 25 and up with a high school diploma or higher, 2015-2019 : | 68.7% |
| Bachelor's degree or higher, proportion of people aged 25 and up, 2015-2019 : | 9.6% |
| Percentage of people under the age of 65 who have a disability, 2015-2019 : | 8.1% |
| Persons under the age of 65 who do not have health insurance, as a percentage : | 18.6% |
| Total civilian labor force, percent of population aged 16 and up, 2015-2019 : | 54.9% |
| Female labor force participation in the civilian labor force, as a percentage of the population aged 16 and up, 2015-2019 : | 51.3% |
| 2012 total retail sales ($1,000) : | 159,636 |
| 2012 total retail sales per capita : | $19,132 |
| Mean commute time to work (in minutes), workers aged 16 and up, 2015-2019 : | 14.9 |
| 2015-2019 median household income (in 2019 dollars) : | $44,009 |
| Income per capita in the previous 12 months (in 2019 dollars), 2015-2019 : | $20,490 |
| Percentage of people living in poverty : | 20.8% |
| Total number of businesses in 2012 : | 666 |
| Men-owned businesses in 2012 : | 332 |
| Women-owned businesses in 2012 : | 212 |
| Minority-owned businesses in 2012 : | 378 |
| Non-minority-owned businesses in 2012 : | 246 |
| Veteran-owned businesses in 2012 : | 30 |
| Nonveteran-owned businesses in 2012 : | 556 |
| 2010 population per square mile : | 1,651.0 |
| 2010 land area in square miles : | 5.02 |
| Rate of owner-occupied housing units, 2015-2019 : | 60.4% |
| Owner-occupied housing unit median value, 2015-2019 : | $91,900 |
| From 2015 to 2019, the median selected monthly owner costs - with a mortgage : | $909 |
| Monthly owner costs, without a mortgage, at the median, 2015-2019 : | $457 |
| 2015-2019 median gross rent : | $978 |
| 2015-2019 Households : | 2,878 |
| Population per household, 2015-2019 : | 3.01 |
| Living in the same house a year ago, percentage of people aged one year and up, 2015-2019 : | 89.1% |
| Languages other than English spoken at home, as a percentage of people aged 5 and up, 2015-2019 : | 35.1% |
| Households with computers, %, 2015-2019 : | 90.8% |
| Percentage of households with a broadband Internet subscription, 2015-2019 : | 75.6% |
| Percentage of people aged 25 and up with a high school diploma or higher, 2015-2019 : | 82.4% |
| Bachelor's degree or higher, proportion of people aged 25 and up, 2015-2019 : | 11.4% |
| Percentage of people under the age of 65 who have a disability, 2015-2019 : | 12.6% |
| Persons under the age of 65 who do not have health insurance, as a percentage : | 15.6% |
| Total civilian labor force, percent of population aged 16 and up, 2015-2019 : | 60.8% |
| Female labor force participation in the civilian labor force, as a percentage of the population aged 16 and up, 2015-2019 : | 55.1% |
| Total sales of lodging and food services in 2012 ($1,000) : | 3,288 |
| Total receipts/revenue for health care and social assistance in 2012 ($1,000) : | 2,911 |
| 2012 total retail sales ($1,000) : | 11,122 |
| 2012 total retail sales per capita : | $1,353 |
| Mean commute time to work (in minutes), workers aged 16 and up, 2015-2019 : | 24.6 |
| 2015-2019 median household income (in 2019 dollars) : | $45,918 |
| Income per capita in the previous 12 months (in 2019 dollars), 2015-2019 : | $20,944 |
| Percentage of people living in poverty : | 19.2% |
| Total number of businesses in 2012 : | 417 |
| Men-owned businesses in 2012 : | 248 |
| Women-owned businesses in 2012 : | 143 |
| Minority-owned businesses in 2012 : | 284 |
| Non-minority-owned businesses in 2012 : | 127 |
| Veteran-owned businesses in 2012 : | 44 |
| Nonveteran-owned businesses in 2012 : | 367 |
| 2010 population per square mile : | 4,241.6 |
| 2010 land area in square miles : | 1.89 |
| Rate of owner-occupied housing units, 2015-2019 : | 66.2% |
| Owner-occupied housing unit median value, 2015-2019 : | $98,300 |
| From 2015 to 2019, the median selected monthly owner costs - with a mortgage : | $1,227 |
| Monthly owner costs, without a mortgage, at the median, 2015-2019 : | $435 |
| 2015-2019 median gross rent : | $663 |
| 2015-2019 Households : | 4,855 |
| Population per household, 2015-2019 : | 2.65 |
| Living in the same house a year ago, percentage of people aged one year and up, 2015-2019 : | 81.4% |
| Languages other than English spoken at home, as a percentage of people aged 5 and up, 2015-2019 : | 35.8% |
| Households with computers, %, 2015-2019 : | 84.3% |
| Percentage of households with a broadband Internet subscription, 2015-2019 : | 75.0% |
| Percentage of people aged 25 and up with a high school diploma or higher, 2015-2019 : | 74.1% |
| Bachelor's degree or higher, proportion of people aged 25 and up, 2015-2019 : | 15.3% |
| Percentage of people under the age of 65 who have a disability, 2015-2019 : | 8.3% |
| Persons under the age of 65 who do not have health insurance, as a percentage : | 21.2% |
| Total civilian labor force, percent of population aged 16 and up, 2015-2019 : | 62.9% |
| Female labor force participation in the civilian labor force, as a percentage of the population aged 16 and up, 2015-2019 : | 54.1% |
| Total receipts/revenue for health care and social assistance in 2012 ($1,000) : | 73,977 |
| 2012 total retail sales ($1,000) : | 181,040 |
| 2012 total retail sales per capita : | $13,281 |
| Mean commute time to work (in minutes), workers aged 16 and up, 2015-2019 : | 20.1 |
| 2015-2019 median household income (in 2019 dollars) : | $46,473 |
| Income per capita in the previous 12 months (in 2019 dollars), 2015-2019 : | $23,439 |
| Percentage of people living in poverty : | 16.9% |
| Total number of businesses in 2012 : | 1,041 |
| Men-owned businesses in 2012 : | 447 |
| Women-owned businesses in 2012 : | 413 |
| Minority-owned businesses in 2012 : | 217 |
| Non-minority-owned businesses in 2012 : | 764 |
| Veteran-owned businesses in 2012 : | 67 |
| Nonveteran-owned businesses in 2012 : | 910 |
| 2010 population per square mile : | 1,332.4 |
| 2010 land area in square miles : | 10.16 |
Services and Civic Places in Rossville
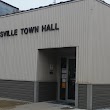
1Rossville Town Hall
17 W Main St, Rossville, IN 46065 View details
Phone: +17653792645 | Website available
Nearby Schools and Colleges
Schools and campuses linked to Rossville, IN. Select a name to open its map and contact details.
| Code | Name | City | ZIP |
|---|---|---|---|
| 491552 | Christina and Company Education Center | Lafayette (IN) | 47905-4633 |
Nearby Transit Stations (6)
Rail and bus stations connected to Rossville, IN. Select a station to open its map and address details.
| Code | Name | Address | Type |
|---|---|---|---|
| LAF | Lafayette station | 200 North 2nd St. | RAIL |
| CRB | Crawfordsville (Bus), Indiana | 1000 Smith Ave | BUS |
| CRF | Crawfordsville | Spring and Green Streets | RAIL |
| REN | Rensselaer | 619 North Cullen Street | RAIL |
| IND | Indianapolis Union Station | 350 South Illinois Street | RAIL |
Closest post offices linked to Rossville.
| Post Office Name | City | ZIP |
|---|---|---|
| Rossvill Post Office | Rossville (IN) | 46065 |
Other places with the same name (5)
- Rossville, Maryland city in Walker County, Georgia, USA with a population of 15,147 people.
- Rossville, Georgia city in Walker County, Georgia, USA with a population of 3,996 people.
- Rossville, Illinois village in Illinois with a population of 1,202 people.
- Rossville, Kansas township in Shawnee County, Kansas with a population of 1,115 people.
- Rossville, Tennessee town in Tennessee, United States with a population of 1,012 people.
Other cities in Clinton County
Cities, towns, neighborhoods & other populated places in Clinton County , IN.
| City Name | Population | Title |
|---|---|---|
| Frankfort | 15,756 | County seat in Indiana |
| Jefferson | 2,523 | Unincorporated community in Clinton County, Indiana |
| Hamilton | 1,595 | Town in Indiana, United States |
| Mulberry | 1,213 | Town in Clinton County, Indiana |
| Kirklin | 773 | Township in Clinton County, Indiana |
| Forest | 748 | Unincorporated community in Clinton County, Indiana |
| Michigantown | 448 | Town in Clinton County, Indiana, United States |
| Colfax | 197 | Town in Perry Township, Clinton County, Indiana, United States |
Distance to Other Cities
Rossville distances to largest Indiana cities